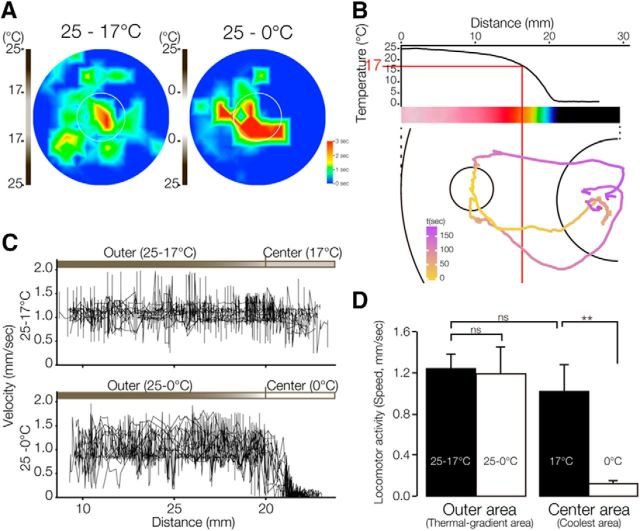
Figure 3.
Thermal preference of planarians on a thermal gradient from 0°C to 25°C. A, Heat map of planarian thermotaxis from 17°C to 25°C and from 0°C to 25°C on a thermal gradient field that was created with a vial containing melting acetic acid or ice water, respectively, under the center of an assay plate (60 mm diameter) filled with water at 25°C. Planarians showed a preference for moving to cooler temperature. B, Top, Graph of the actual temperature on a thermal gradient field from 0°C to 25°C and a heat map from 0°C to 25°C measured using an infrared thermography camera. Bottom, Representative trajectories of 3 planarians starting from the circle on a thermal gradient plate using 0°C ice water at the center. Lines are shown in pseudocolor to represent the time of movement. C, Velocity plot of planarians moving toward the coolest area. Top, Planarian velocity plot on thermal gradient field from 0°C to 25°C. Bottom, Planarian velocity plot on thermal gradient field from 17°C to 25°C. Near the 0°C region, animals' motility was drastically inhibited. D, Statistical comparison of the planarian locomotor activity between a thermal gradient with coolest area at 17°C (black columns) and a thermal gradient with coolest area at 0°C (white columns). **p < 0.01. ns, Not significant.

