Figure 3.

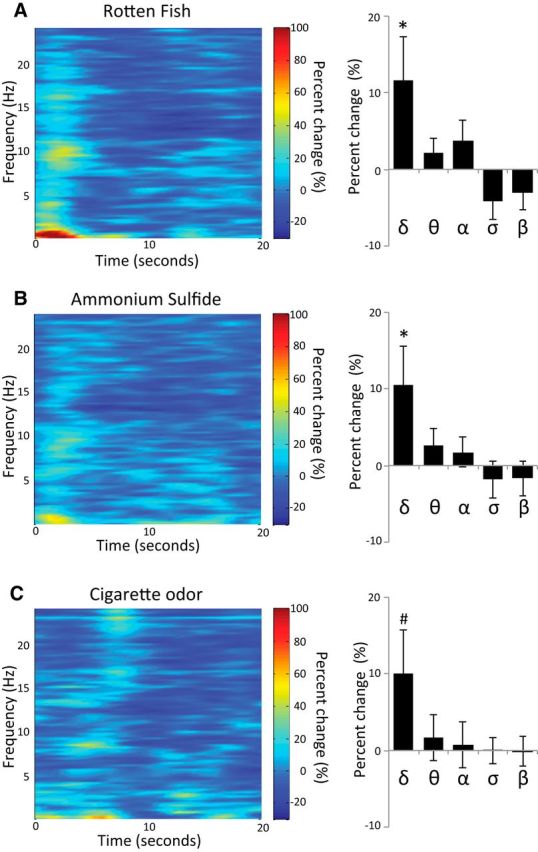
Odors did not awaken subjects. A–C, EEG spectral analysis of 20 s after odor onset in the δ, θ, α, σ, and β frequency band following (A) RF, (B) AmSu, and (C) cigarette odor. *p < 0.05, #p = 0.08.

Odors did not awaken subjects. A–C, EEG spectral analysis of 20 s after odor onset in the δ, θ, α, σ, and β frequency band following (A) RF, (B) AmSu, and (C) cigarette odor. *p < 0.05, #p = 0.08.