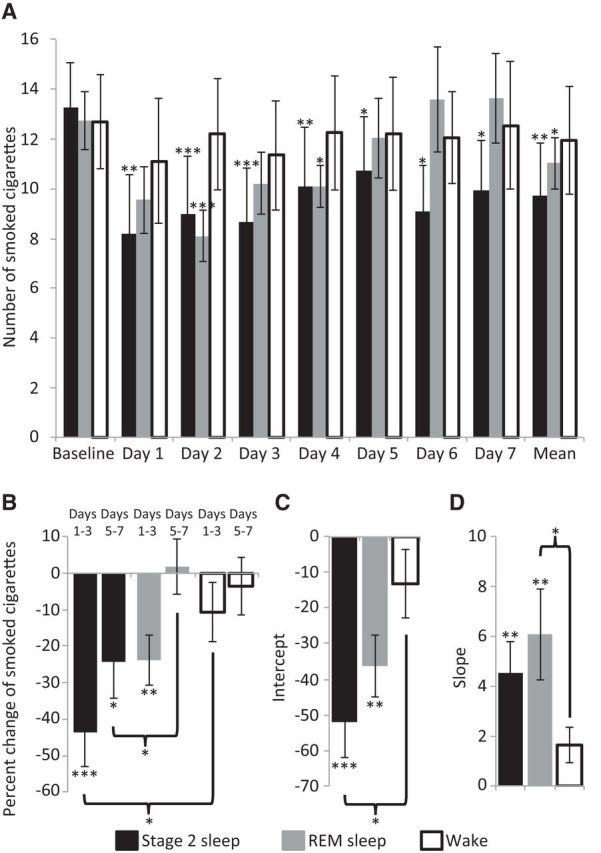
Figure 5.

Aversive conditioning during sleep reduced subsequent smoking. A, Number of smoked cigarettes at baseline and in each day following olfactory aversive conditioning during stage 2 sleep (black), REM sleep (dark gray), and wake (outline). B, Percentage change in smoked cigarettes in the first half (days 1–3) and second half (days 5–7) of the experiment following conditioning during stage 2 sleep (black), REM sleep (dark gray), and wake (outline). C, D, Intercept (C) denoting the effect size of the change in smoked cigarettes and slope (D) denoting the change in smoked cigarettes across 7 PE days, following olfactory aversive conditioning during stage 2 sleep (black), REM sleep (dark gray), and wake (outline). *p < 0.05, **p < 0.01, ***p < 0.005.
