
Figure 10.
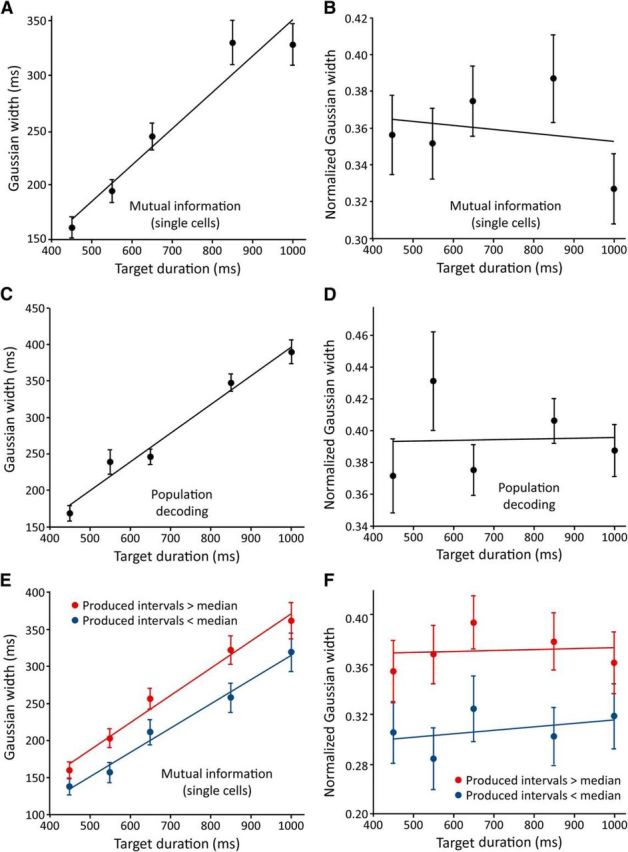
Average serial-order MI and decoding time course widths as a function of duration. A, MI of each cell's firing rate and serial order were calculated at each bin, separately at each duration. Gaussian curves were fitted to each MI time course and their width parameters (in milliseconds) were averaged across cells (N = 99, 105, 110, 76, 77 curve widths for durations of 450, 550, 650, 850, and 1000 ms; these numbers vary because the nonlinear regression was not able to fit all time courses). B, The data from A are re-expressed as a fraction of an instructed interval duration. C, D, Time-resolved population decoding of serial order was performed separately at each duration, and Gaussian curves were fitted to the resulting time courses (N = 13, 16, 15, 17, 17 curve widths for durations 450–1000 ms). Average widths in milliseconds shown in C and widths normalized to intertap interval shown in D. E, F, The MI analysis was repeated for intervals that were split into those whose actual durations were above (red) and below (blue) the median for that instructed duration. All error bars ± SEM.