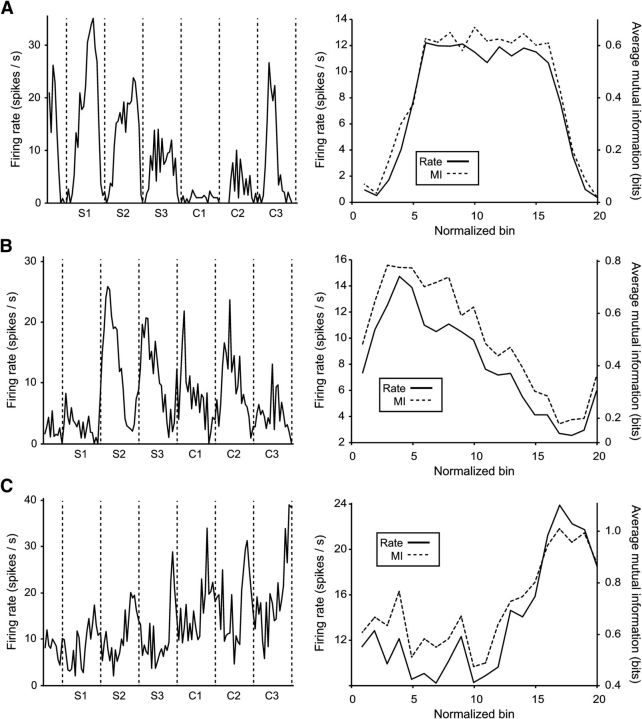
Figure 3.
Activity of sample cells, averaged across intertap interval durations using normalized bins (20 bins per interval for all durations). A, Left, Shows the average firing rate (across 30 trials) of a neuron whose activity varied as a function of the serial order of intertap interval. Vertical lines indicate tap events. The three Synchronization intervals (S1–S3) and three Continuation intervals (C1–C3) are indicated under the x-axis. Right, Shows the average firing rate (solid line) and MI of firing rate and serial order (dashed line), within the intertap interval, across 180 observations (30 trials × 6 serial orders). B, C, Activity of two other cells with activity significantly related to serial order. Maximum possible MI = 2.58 bits.

