
Figure 4.
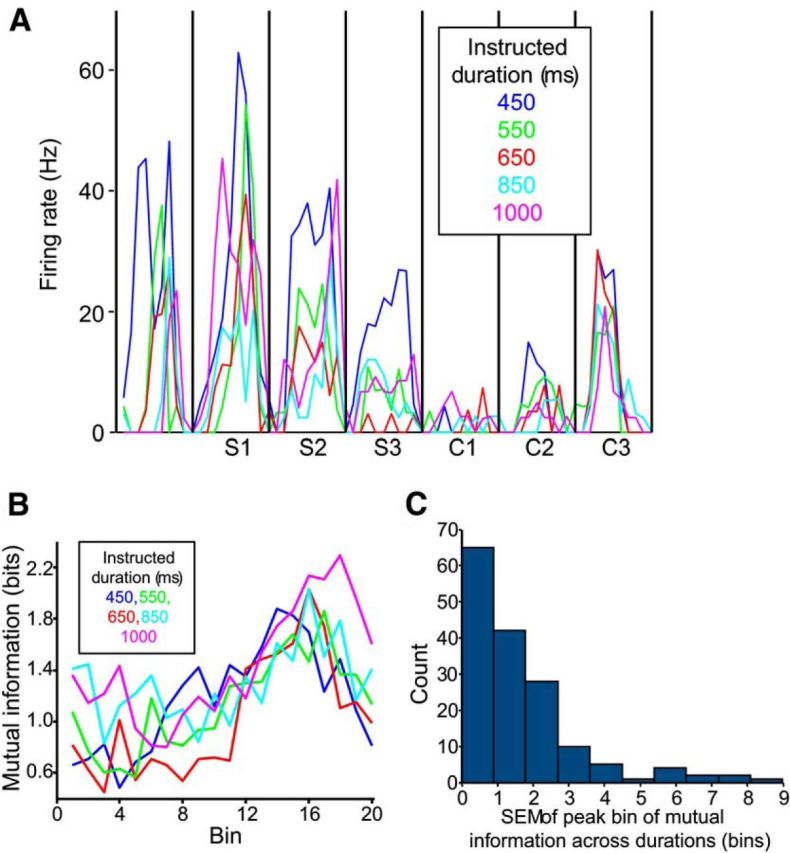
The activity of serial-order cells across interval durations (20 bins per interval). A, The average firing rate of a serial-order neuron, across the five instructed intertap durations (5 trials per duration). Vertical lines indicate tap events. Synchronization (S1–S3) and Continuation (C1–C3) intervals are indicated under the x-axis. B, The MI time courses for a serial-order neuron, across the five durations (30 observations–6 serial orders × 5 trials–per point). MI tended to peak late in the interval at all durations (maximum possible MI = 2.58 bits). C, Gaussian curves were fit to each cell's MI time course, at each duration (e.g., the lines in B). We calculated the SEM of the peaks of these curves (in bins), for each cell, across durations. The histogram shows these SEM values; lower values indicate cells with similar peaks across durations (e.g., the cell in B). Data are from 169 cells with at least two successful Gaussian fits with peaks in the bin range.