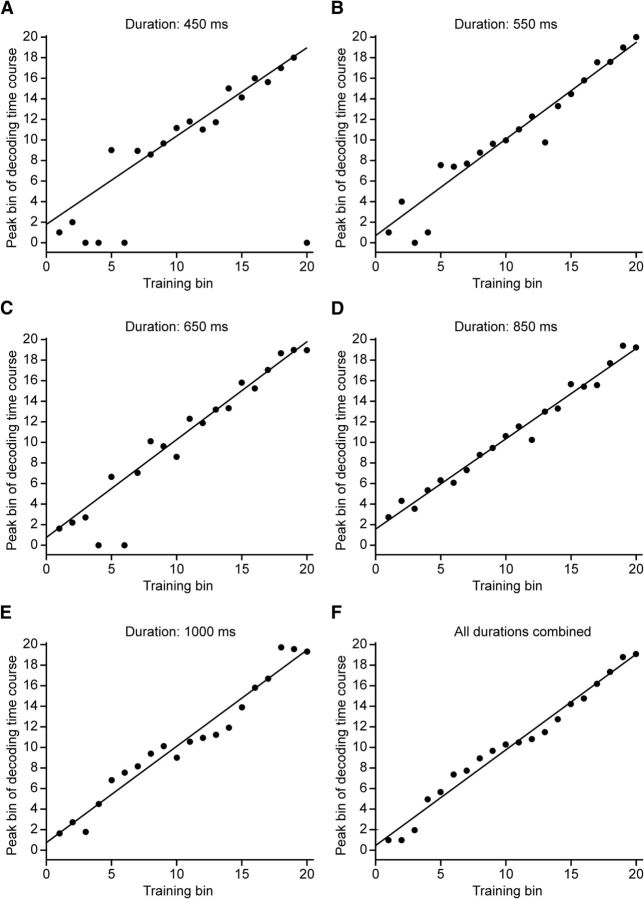
Figure 9.
Serial-order decoding time course peaks as a function of training bins, at each instructed duration. A–E, Each dot represents the peak, in time bins, of a fitted Gaussian curve to the decoding time course obtained when the decoder was trained at the bin indicated on the x-axis (30 observations; 5 trials × 6 serial orders). Nonlinear regression was used to produce the fits. Dots at bin zero on the y-axis represent a failure of the nonlinear regression to provide a fit. Each instructed duration (450–1000 ms) was broken into 20 equal bins. Lines indicate a best fit of all nonzero points. F, Decoding time course peaks when data from all durations were combined (150 observations; 5 trials × 5 durations × 6 intervals).

