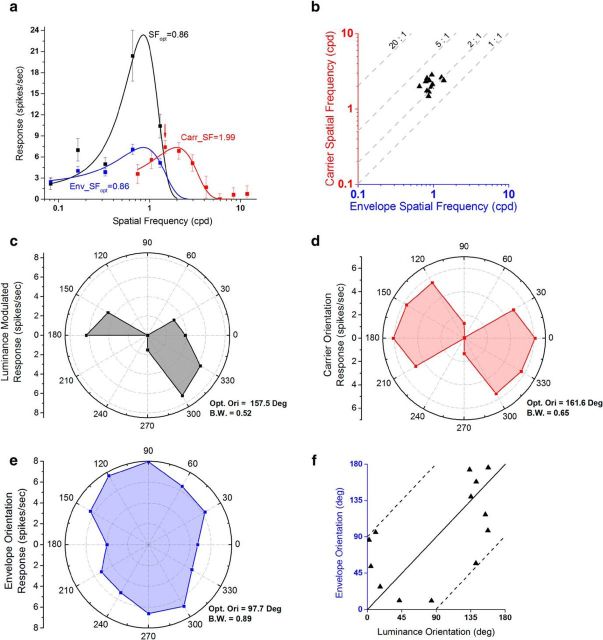
Figure 7.
Tuning properties of response to CM gratings having carrier SFs inside a neuron's frequency-selective range for luminance gratings. a, Example of SF responses for one neuron. The SF tuning for luminance gratings is plotted in black. The CM tuning properties of this neuron were measured with a carrier SF (red arrow) that was inside the neuron's frequency-selective range for luminance gratings. The SF tuning for envelope responses is plotted in blue. Error bars indicate ±SE. b, Scatter plot of results from several similarly tested neurons. Each point indicates one neuron's carrier SF plotted against its optimal envelope SF. All points are distributed around a 2:1 ratio line (hence we refer to these as 2:1 neurons; N = 12). c–e, Orientation polar plots for the same neuron shown in a, for luminance gratings (c, black), CM carriers (d, red), and CM envelopes (e, blue). Distance from the origin represents magnitude of response and polar angle represents orientation. Optimal orientation (Opt. Ori) and bandwidth (B.W.) of each tuning curve are given at bottom-right of the plot. f, Scatter plot of 2:1 neurons' optimal envelope orientations plotted against their optimal luminance orientations (N = 13). Spontaneous activity was removed in tuning curve plots (a, c–e).

