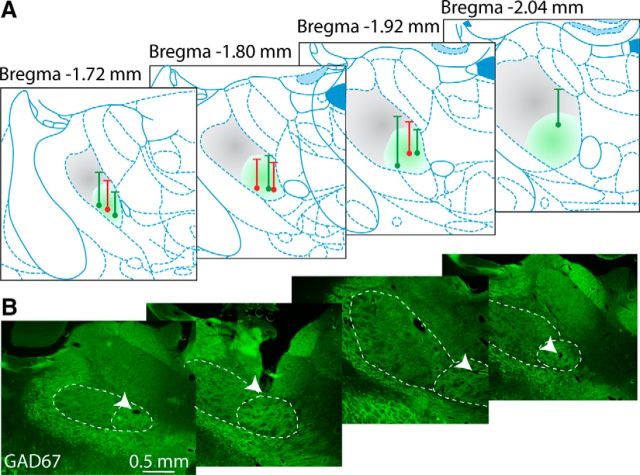
Figure 2.
Location of recording electrode tracks in the Mthal. A, Dots on atlas sections at different anteroposterior levels of Mthal (Paxinos and Watson, 2007) show the position of terminal electrolytic lesions made at the end of recording tracks from control (green) and 6-OHDA lesioned animals (red). Vertical lines show the track and horizontal lines show the calculated point from which recordings began or began to be included in the analysis if the first recordings were made dorsal to the Mthal. Shading indicates approximate positions of CB-receiving (VL, gray) and BG-receiving (VA, green) territories of Mthal, determined by GAD67 (B) and VGluT2 staining (data not shown). B, Representative histological sections at approximate levels shown in A stained for GAD67 (green). BG territory has dense immunohistochemical staining for GAD67 compared with CB territory. CB- and BG-receiving territories are delineated with white dashed lines. White arrows indicate the end of recording tracks.

