Figure 7.

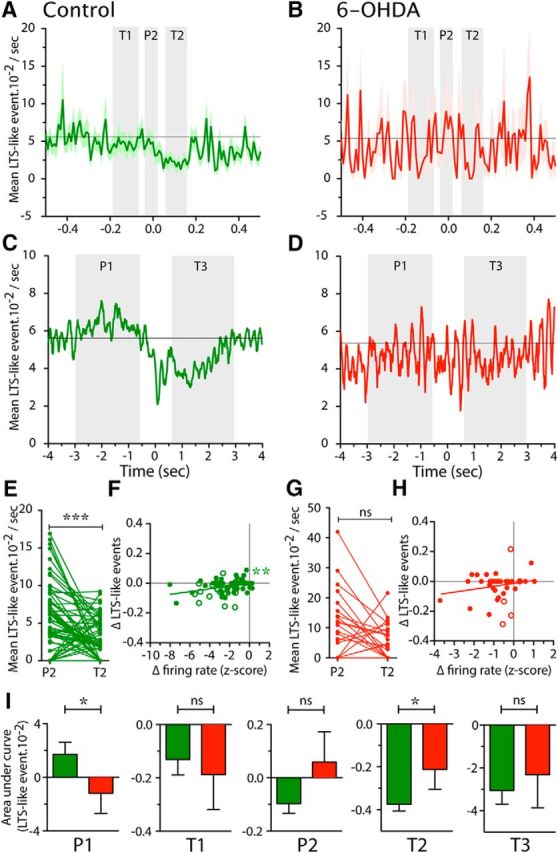
Modulation of LTS-like events during reaching in control and 6-OHDA lesioned rats. A–D, Mean occurrence of LTS-like events across all recorded neurons in control (A, C, green) and 6-OHDA (B, D, red) rats, aligned to the terminal part of the reach (interruption of beam 2: t = 0 s) during narrow (±0.5 s; A, B) and wide timescales (±4 s; C, D). P1–P2 and T1–T3 (shaded in light gray) show the 5 periods we defined as peaks and troughs, respectively, consistent with Figure 6. In A and B, data are presented as mean (thick line) ± SEM (shaded area) and in C and D as the smoothed mean. E, G, Plot of the mean occurrence of LTS-like events at the time of P2 and T2 for each neuron recorded in control (E, green) and 6-OHDA (G, red) rats. ***p < 0.001, paired t test. F, H, Correlation plots of the change (Δ) in LTS-like events (difference between LTS-like events at P2 and T2) with the Δ in firing rate (difference of mean spiking activity at P2 and T2). Each dot represents one neuron, filled circles are neurons recorded in BG territory (control rats: G, green; 6-OHDA rats: I, red), open circles represent neurons recorded in CB territory of Mthal. Straight lines represent the linear regression. **Linear regression significantly different from 0 (p < 0.01). I, Mean area under modulation curves for P1–P2 and T1–T3 periods for control (green) and 6-OHDA (red) rats. *p < 0.05; Mann–Whitney tests.
