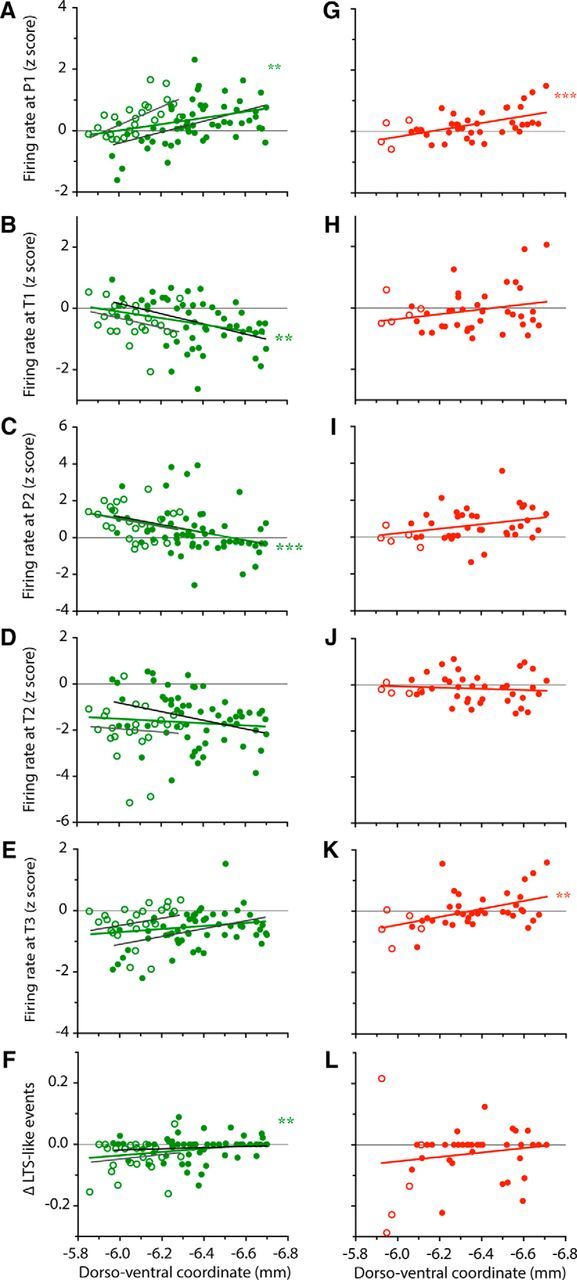
Figure 8.

Movement-related activity depends on the neuron's location in the Mthal. Scattergrams of the dorsoventral location of recorded neurons plotted against their firing rate at the P1 (A, G), T1 (B, H), P2 (C, I), T2 (D, J), T3 (E, K) and Δ occurrence of LTS-like events (F,L). For all graphs, filled circles represent neurons recorded in BG territory and open circles represent neurons recorded in CB territory of Mthal. Data for control and 6-OHDA rats are represented in green (A–F) and red (G–L), respectively. Linear regressions are represented by straight lines (green for all neurons in control rats, light gray for CB territory control neurons, dark gray for BG territory control neurons, red for 6-OHDA lesioned rats) and asterisks indicate when the regression was significantly different from 0 (**p < 0.01; ***p < 0.001).
