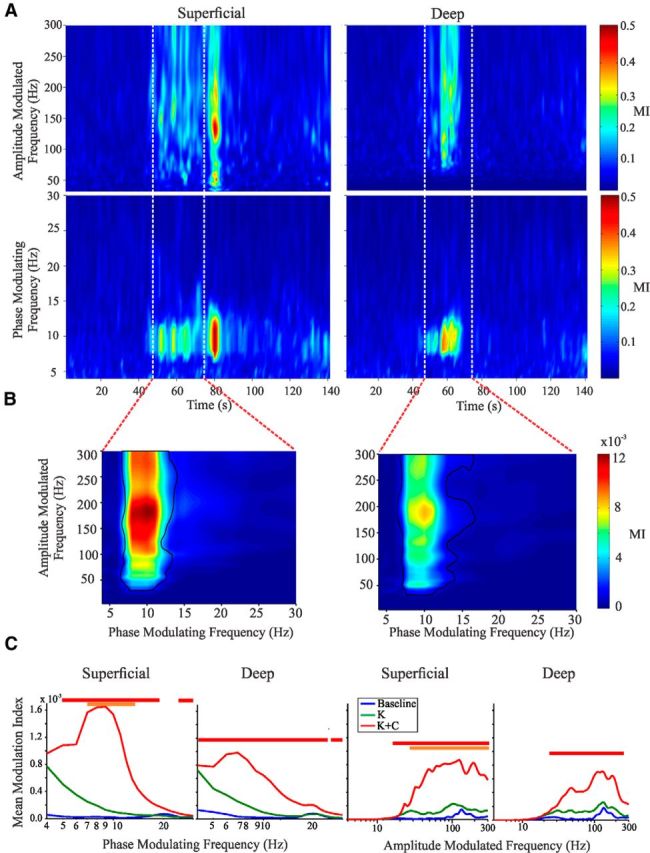
Figure 2.

PAC waxes and wanes in superficial and deep cortical layers. A, Representative slice under kainate and carbachol conditions. Maximum values of MI for all amplitude-modulated frequencies (top figures) and phase-modulating frequencies (bottom figures) as a function of time, computed using 2 s windows with 1 s overlap. B, Full plots of MI for all phase-modulating and amplitude-modulated frequencies for the window of time indicated by the red lines in A; black lines indicate areas of significance determined via bootstrapping (α = 0.05). This 30 s window had been chosen previously for our primary analyses (Florez et al., 2013). C, Group statistics (see Materials and Methods) for MI comparing baseline, kainite, and kainite plus carbachol treatments. Lines above the graphs indicate significance (red indicates kainate plus carbachol > baseline; orange indicates kainate plus carbachol > kainate; green indicates kainate > baseline). K, Kainate; K + C, kainate plus carbachol.
