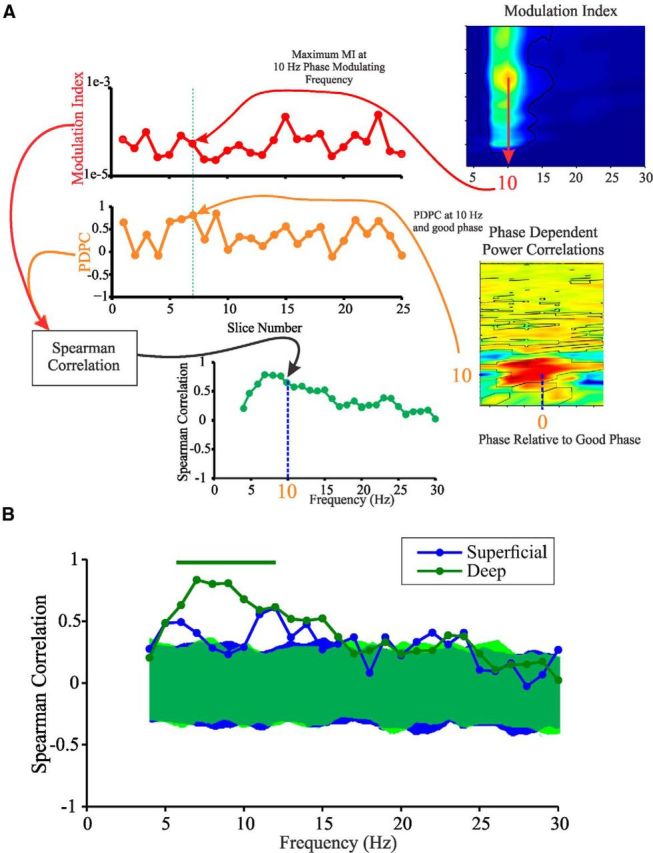
Figure 3.

PDPC and MI are correlated at theta frequencies across slices. A, Schematic of the analysis for determining the correlation between PDPC and MI across slices. For each phase-modulating frequency and experimental condition, the maximal value of MI was found for each experimental trial and stored. The value of PDPC along the good phase was also stored for each frequency. A Spearman's rank correlation was then performed for the stored values for each frequency and experimental condition. The values of the Spearman's rank correlations were then plotted. B, Results of this analysis during kainate plus carbachol conditions. Bar above the plots indicates regions of significance for deep layers. Shaded regions in the plot indicate the 95% confidence intervals obtained from surrogate-generated correlation coefficient value distributions.
