Figure 4.

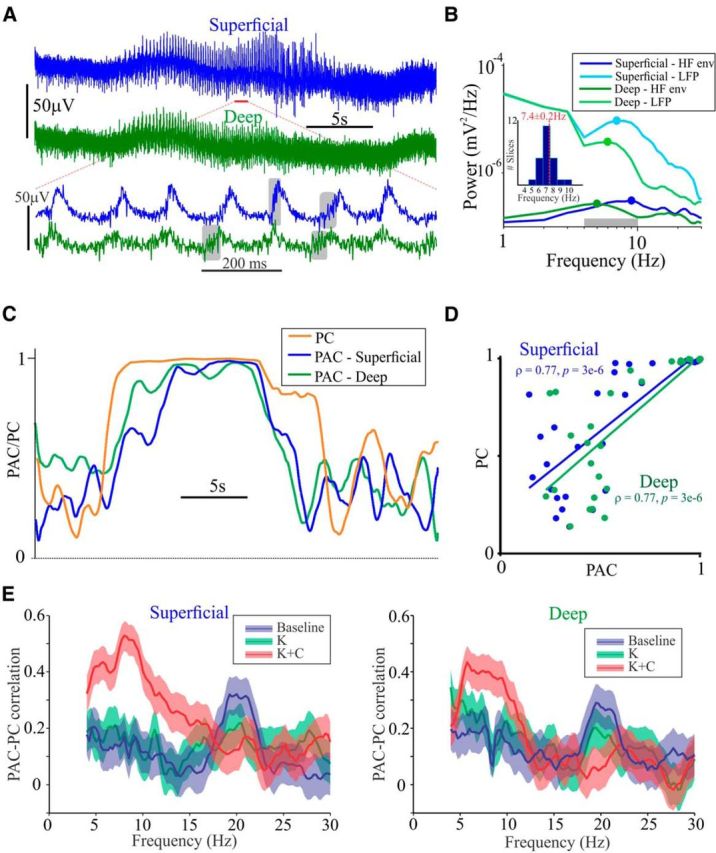
PAC and PC are correlated on a moment-to-moment basis. A, Exemplary 30 s of raw data displaying the waxing and waning in amplitude of cortical oscillations observed under kainate plus carbachol conditions. Below is an expanded region demarcated by the red bar. Gray boxes highlight some visually apparent examples of high-frequency activity. B, Power spectra of LFP and high-gamma envelope. The gray bar represents the frequency range over which PAC was estimated and equaled the minimum and maximum of these four values, −1 and +1 Hz, respectively. Inset plots the distribution of the average of this range computed analogously for each slice and associated mean ± SEM (red) of the group. Note that neither the peaks of the high-gamma envelopes were identical nor were the LFP for the deep and superficial layers. HF env, High-frequency envelope. C, PAC and PC values. Timescale is identical to top traces in A. D, Spearman's rank correlation between 1 s non-overlapping segments of PAC and PC for both superficial and deep cortical layers. A linear regression line is included for visualization only. E, Wavelet-based group statistics. PAC–PC correlations as a function of frequency plotted with 95% confidence intervals. K, Kainate; K + C, kainate plus carbachol.
