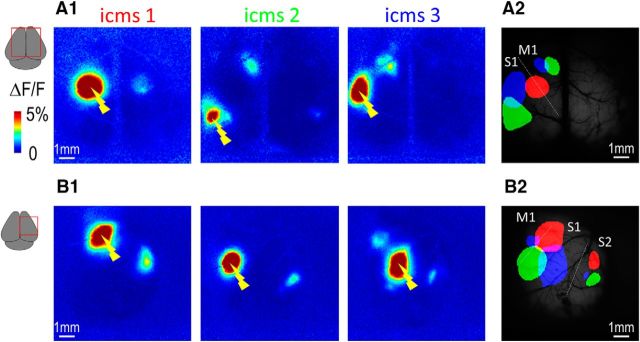
Figure 10.
Cortical stimulation mapping of functional connections. A1, Calcium responses (maximum ΔF/F) for cortical stimulation (ICMS) in three different locations of area S1 through a bilateral acute craniotomy. A2, Location of thresholded functional responses (in red, green, and blue) overlaid on the basal GCaMP fluorescence. Contralateral responses being lower than the threshold, they do not appear on these thresholded images. B, Calcium responses in area S2 for cortical stimulations in three different locations of area S1 through a unilateral acute craniotomy.

