Figure 3.
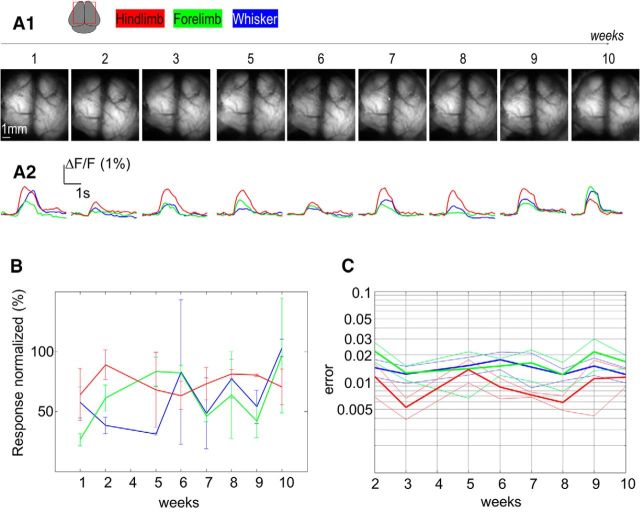
Longitudinal recording of sensory response. A, Top, Representative example of basal GCaMP fluorescence through an 8-mm-wide coverslip chronic window exposing ∼50 mm2 of cortex during 10 consecutive weeks in one mouse. Bottom, Contralateral normalized responses for HL (red), FL (green), and WS (blue) stimulation. B, Response (amplitude normalized by the maximal amplitude observed during the period) for WS (blue), FL (green), and HL (red) stimulation during the 10 consecutive weeks (n = 2 mice). C, Error (see Materials and Methods) between sensory map of the first week and the 10 consecutive weeks (thin lines indicate SEM; n = 14).

