
Figure 4.
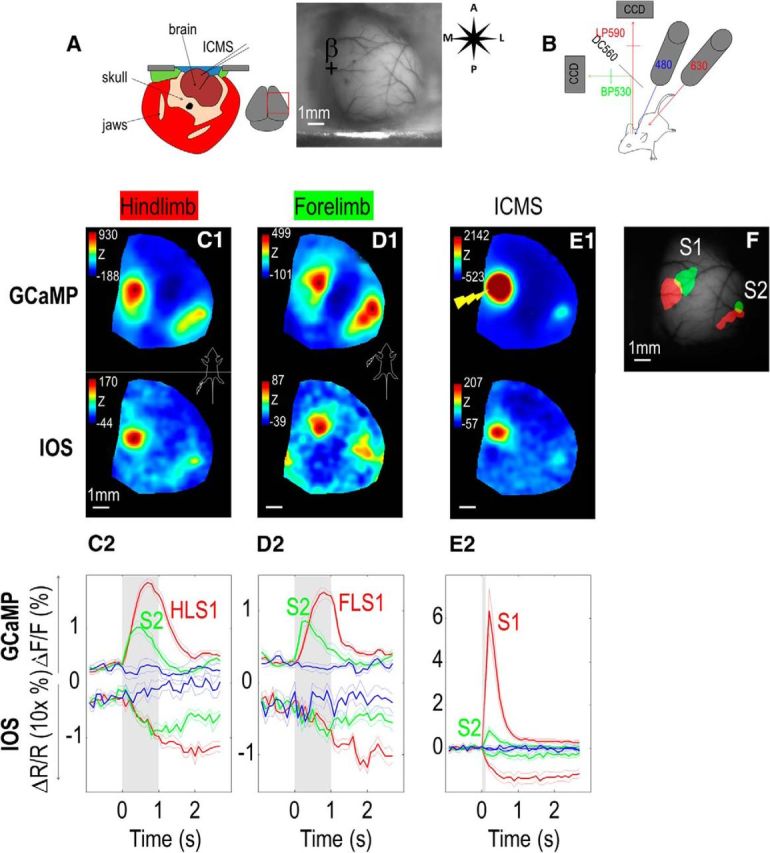
Sensory response recorded through an acute unilateral craniotomy. A, Diagram of the acute craniotomy in a coronal section of the head and green reflectance image. B, Diagram of the dual calcium/IOS imaging setup. Red (630 nm) and blue (480 nm) LEDs were used to illuminate the cortex. Collected light passed through a 560 dichroic filter. Green fluorescence was then filtered with a bandpass green filter (530 nm), whereas the IOS signal was filtered with a long pass red filter (590 nm). C1, Calcium and IOS responses (Z-score) for hindlimb stimulation (1 s train of 1 ms pulses, 100 Hz). C2, Temporal profile of calcium fluorescence and IOS signal (expanded 10× for a better comparison with calcium signal profile) in ROI within the contralateral HLS1 (red represents with stimulation; blue represents without stimulation) and S2 (green). D, Same as in C, response and temporal profile for forelimb stimulation. E, Same as in C, D, response and temporal profile for ICMS within area S1 (100 ms train of 0.1 ms × 100 μA electric pulses, 400 Hz). F, Location of calcium responses for hindlimb (red) and forelimb (green) stimulation overlaid on the basal GCaMP fluorescence.