
Figure 7.
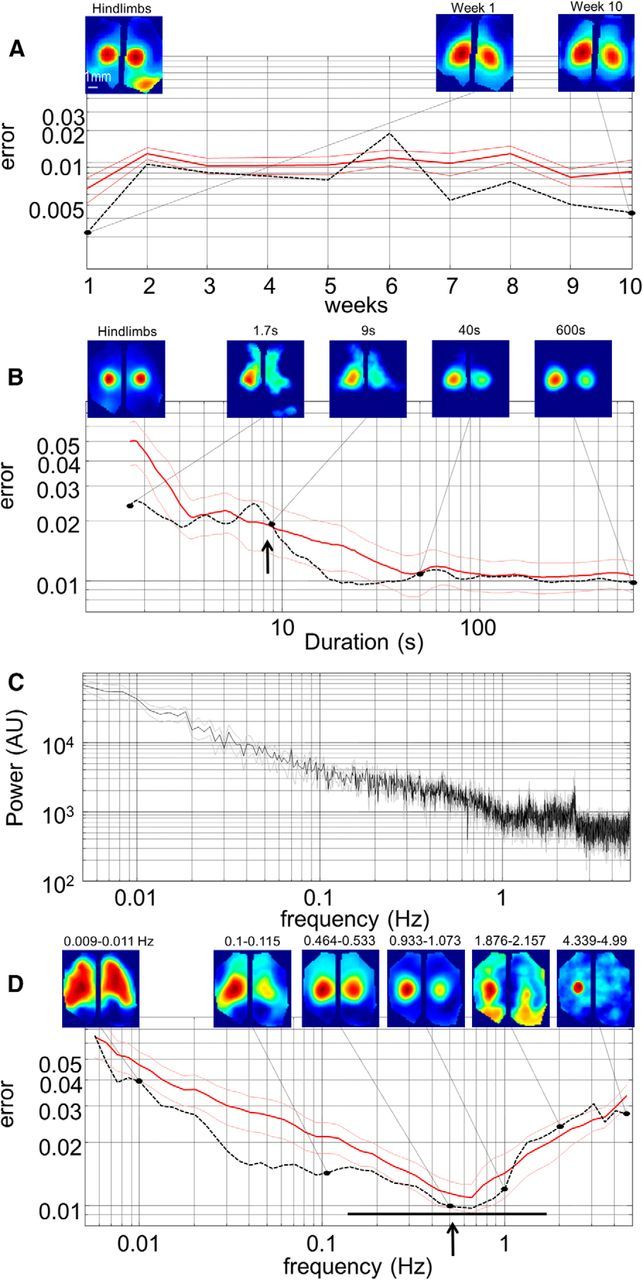
Consistency, duration, and frequency band of long-range correlated spontaneous activity mapping. A, Error (see Materials and Methods) between sensory map and seed pixel map recorded at different times ranging during 10 weeks (red curve, thin lines indicate SEM; n = 12). Dotted line indicates error observed in one animal with characteristic seed pixel correlation maps (for hindlimb location in area S1) for the first and last week presented above the graph with hindlimb sensory map used as a reference (left). B, Error between sensory map and seed pixel map for different recording durations ranging from 1.7 to 600 s (n = 10). Dotted line indicates error observed in one animal with characteristic seed pixel maps for 1.7, 9, 40, and 600 s recording durations presented above the graph with hindlimb sensory map used as a reference (left). Arrow indicates 9.1 s cutoff corresponding to −3 dB. C, Fourier transform of the calcium activity (gray lines indicate SEM; n = 10). D, Error between sensory map and seed pixel map for different frequency bands ranging from 0.005 to 5 Hz with characteristic seed pixel maps for 6 frequency bands indicated above the maps. Arrow indicates optimal frequency (n = 10); black horizontal bar represents −3 dB band cutoffs.