
Figure 8.
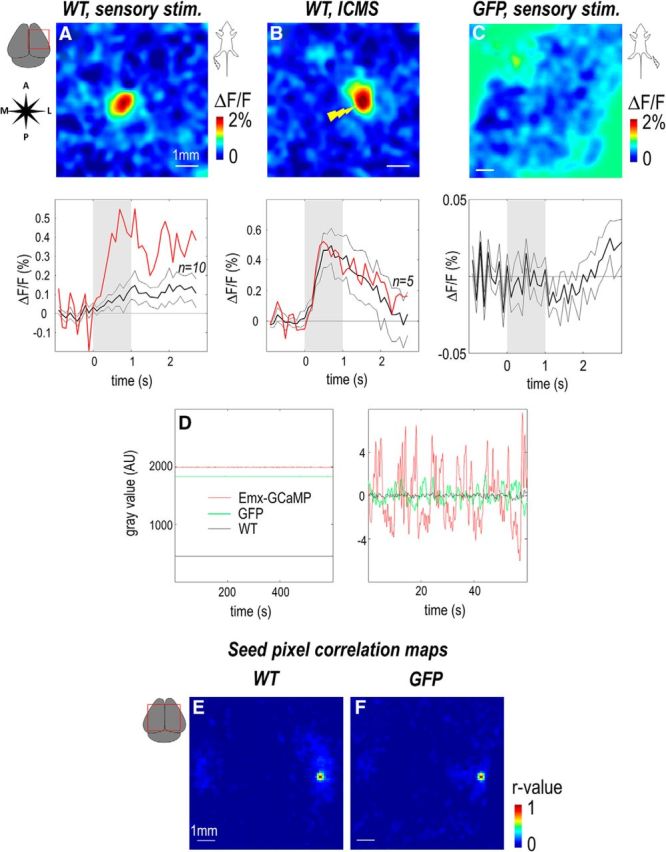
GCaMP Fluorescence is minimally affected by flavoprotein and blood volume artifact. A, B, Responses (maximum ΔF/F) and temporal profiles of green fluorescence for hindlimb stimulation (1 s train of 1 ms pulses, 100 Hz) and ICMS (1 s train of 0.1 ms × 100 μA electric pulses, 400 Hz) in a wild-type animal. Red curves represent profile of the example displayed. Black curves represent profile and SEM of the averaged response for all animals tested. C, Response and profile of green fluorescence for forelimb stimulation in a GFP mouse. D, Left, Spontaneous fluctuations of green fluorescence of Emx-GCaMP (red, n = 2), wild-type (black, n = 1), and GFP mice (green, n = 2). Right, Close-up of 60 s of recording after DC value subtracted. E, F, Seed pixel cross-correlation map calculated on wild-type and GFP mice.