
Figure 2.
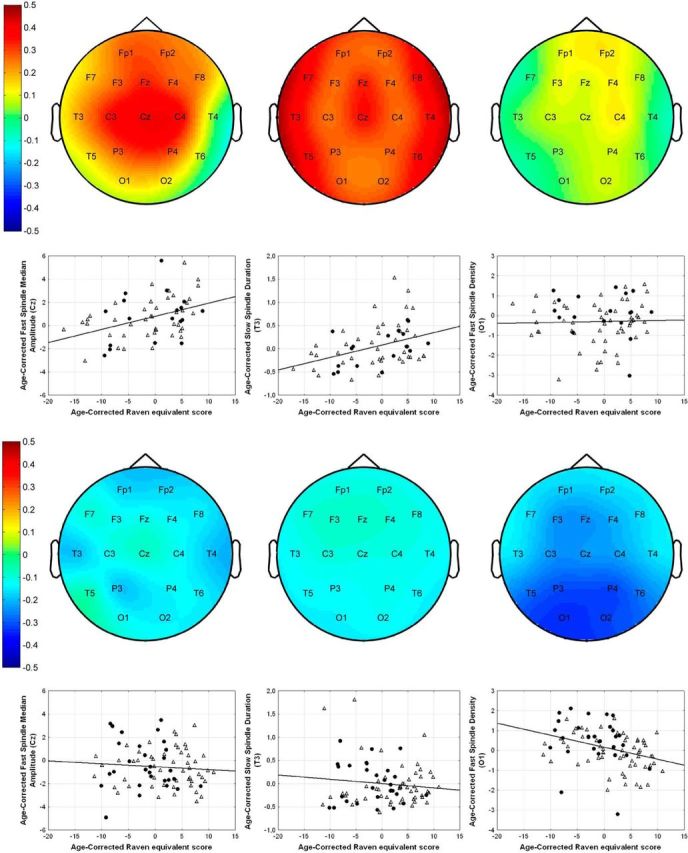
Scalp maps and partial regression plots for females (top half) and males (bottom half), for Cz fast spindle median amplitude (left), T3 slow spindle duration (middle), and O1 fast spindle density (right). Scalp maps illustrate the topographical distribution of the strength of partial correlations between Raven equivalent scores and sleep spindle parameters. On the partial regression plots, x-axes represent the residuals after regressing Raven APM scores against age. y-axes represent the residuals after regressing spindle parameters against age. Thus, these scatterplots demonstrate the relationship between Raven APM scores and spindle parameters after pruning both variables for the effects of age. Standard Pearson correlation between the shown residuals equals the age-corrected partial correlations between Raven APM scores and spindle parameters. Dots represent data points from the Budapest sample. Triangles represent data points from the Munich sample.