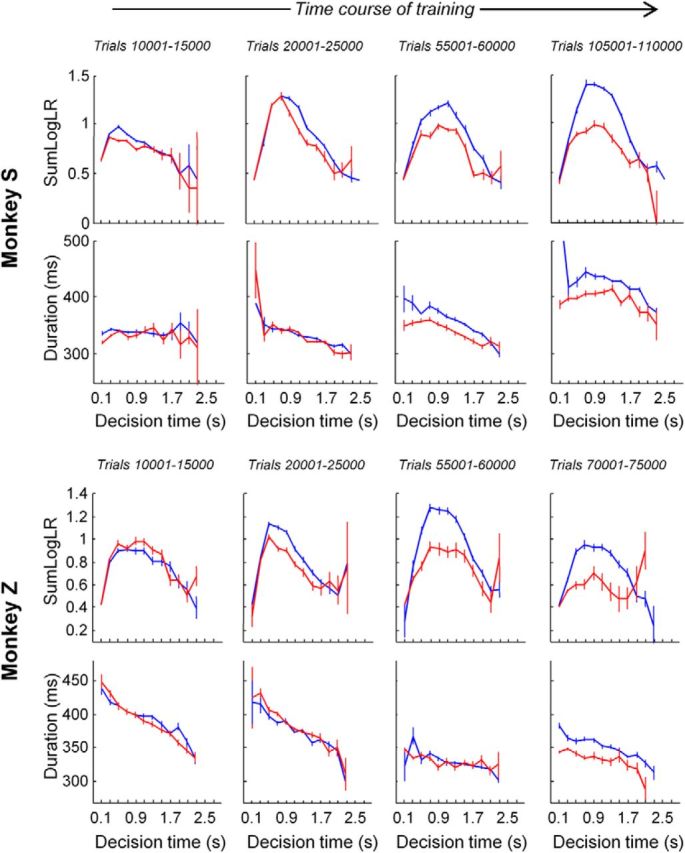
Figure 7.

Top row, Mean SumLogLR (±SE) of Monkey S as a function of decision duration in the slow (blue) and the fast (red) blocks during the four periods of training indicated by arrows in Figure 2A (left). Each period consists of 5000 trials performed in either block. Second row, Mean (±SE) arm movement duration of Monkey S as a function of decision duration in the two blocks during the same four periods of training. Third row, SumLogLR for Monkey Z in the four periods of training indicated in Figure 2A (right). Fourth row, Mean movement duration for Monkey Z in the same four periods of training.
