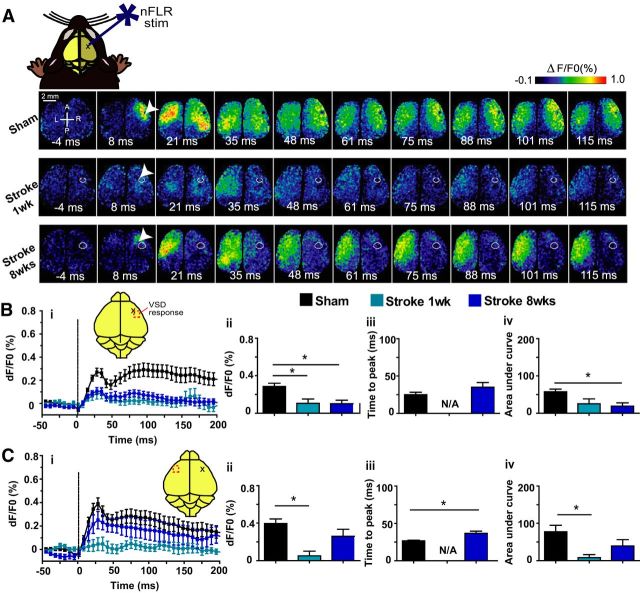
Figure 3.
VSD imaging maps of photostimulation of the injured forelimb cortex results in stronger and faster VSD responses than expected from sensory stimulation. A, Example VSD responses in a bilateral craniotomy preparation after photostimulation of the right (injured) forelimb somatosensory cortex in a sham animal (top), 1 week after stroke (middle), and 8 weeks after stroke animal (bottom). The lesion in the stroke animals is indicated by the white circle. White arrows indicate laser photostimulation target. Quantitative comparisons of the VSD response from the right (injured) hemisphere (B) and left (non-injured) hemisphere (C). i, Intensity versus time plot of the VSD response. ii, Peak amplitude (df/F0%) VSD response. iii, Time (ms) to peak amplitude. iv, Area under the curve to 20 ms after stimulation. *p < 0.05. Time to peak is not shown in the 1 week after stroke condition due to only a few samples showing a well defined peak in the response.

