
Figure 2.
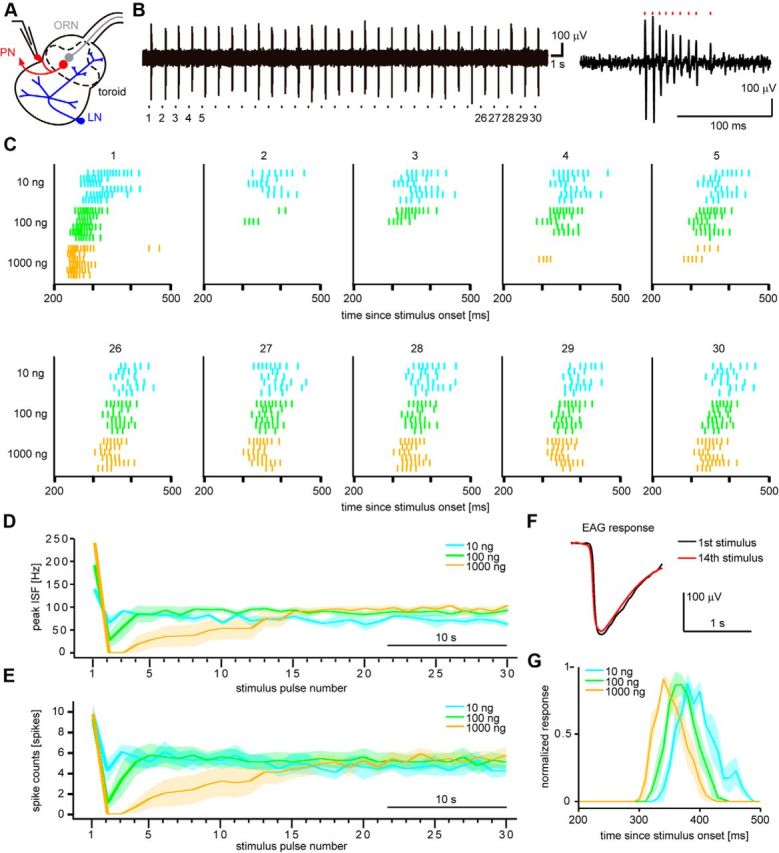
PN responses to intermittent bombykol stimuli. A, Schematic diagram of the antennal lobe of the male silkmoth showing bombykol-responsive ORNs (gray), bombykol-responsive PNs (red), and local interneurons (LNs, blue). Dashed line indicates the toroid glomerulus processing bombykol information. Loose-patch recording was performed at PN somata. B, Representative example of PN responses to 10 ng bombykol intermittent stimuli (left). Stimulus pulse numbers corresponding to the raster plots in C are indicated under the recording trace. The response to the first stimulus pulse is shown in the rightmost panel. Red markers indicate the occurrences of spikes. The stimulus duration of the pheromone pulses was 200 ms at 1.2 s period. C, Raster plots of PN responses to the first to fifth stimulus pulses (top) and to the 26th to 30th pulses (bottom) (n = 6). D, E, Dynamics of average peak ISF (D) and average spike counts (E) of PN responses (n = 6). F, Representative example of EAG responses to the first stimulus pulse (black) and to the 14th stimulus pulse (red) of a series of 1000 ng bombykol pulses. To prevent adaptation, antennae were covered by a slide glass between the two recordings while stimuli were continuously delivered at 1.2 s interval. G, Peristimulus time histograms (10 ms bins) of PN responses in the settled state (n = 6). Responses to last 10 stimuli were averaged and normalized for each concentration within preparations. Shaded areas represent SEM.