
Figure 3.
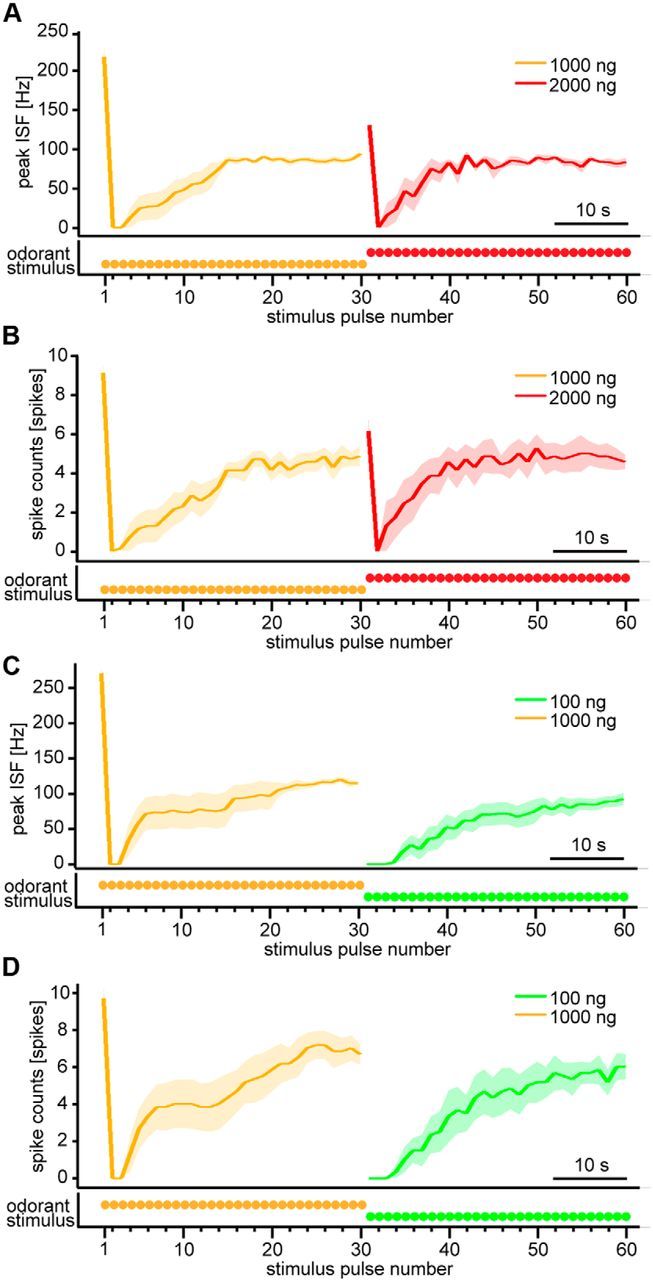
PN responses to intermittent bombykol stimuli upon odorant concentration changes in pulse trains. A, B, Dynamics of average peak ISF (A) and average spike counts (B) of PN responses with odorant concentration increase (n = 7). Odorant concentration was increased from 1000 to 2000 ng after the 30th stimulus pulse. C, D, Dynamics of peak ISF (C) and spike counts (D) of PN responses with odorant concentration decrease (n = 6). Odorant concentration was decreased from 1000 to 100 ng after the 30th stimulus pulse. The stimulus duration of the pheromone pulses was 200 ms at 1.2 s period. Traces below the figures represent stimulus timing and odorant concentration schematically. Shaded areas represent SEM of the responses.