
Figure 4.
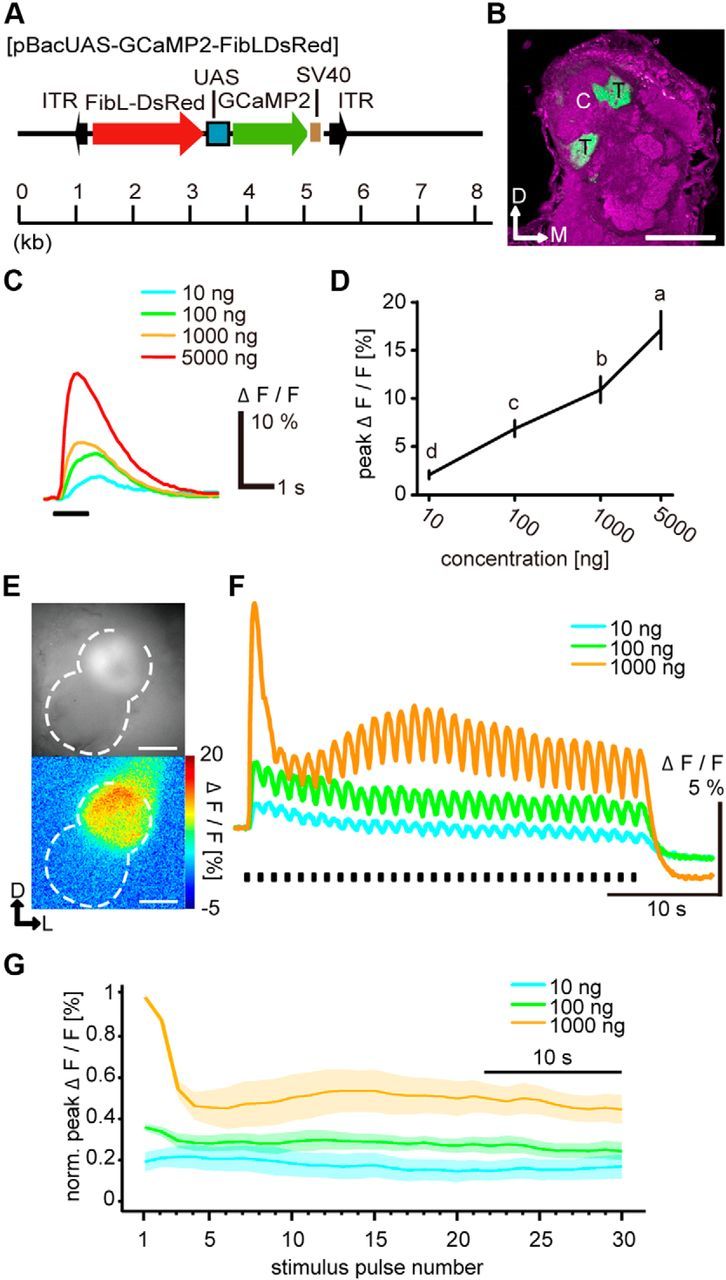
ORN responses to intermittent bombykol stimuli. A, Schematic diagrams of the piggyBac vector, pBacUAS-GCaMP2, used to generate UAS-GCaMP2. FibL-DsRed indicates a screening marker that drives DsRed expression in silk glands. ITR, Inverted terminal repeats of the piggyBac transposon; SV40, SV40 polyadenylation signal. B, Representative confocal image of the AL of a BmOR1-GAL4/UAS-GCaMP2 male moth. The axon terminals of bombykol receptor neurons expressing GCaMP (green) were localized in the toroid. Background staining was performed with an anti-synaptotagmin antibody to visualize neuropil structures (magenta). Representative confocal sections are shown. C, Cumulus; T, toroid; D, dorsal; M, medial. Scale bar, 100 μm. C, Representative GCaMP-expressing neuronal responses to single-pulse bombykol stimulus. Stimulus duration was 1 s. D, Concentration–response characteristics of GCaMP-expressing neurons to single-pulse bombykol stimulus (one-way repeated-measures ANOVA, F(3,5) = 48.33, p < 0.001) followed by Tukey–Kramer test (p < 0.05 for significant differences indicated by different letters associated with the data groups. Data are means. Error bars indicate SEM; n = 6. E, Fluorescence images of the terminal axonal arborization of GCaMP-expressing ORNs (top, averaged for 10 baseline frames) and their responses to 1000 ng bombykol in false colors (bottom). Dashed line indicates the outline of the AL. D, Dorsal; L, lateral. Scale bar, 100 μm. F, Representative time courses of ORN responses to intermittent bombykol stimuli. The stimulus duration of bombykol pulses was 200 ms at 1.2 s period. G, Dynamics of average normalized peak amplitudes of ORN responses (n = 6). Shaded areas represent SEM of the peak amplitudes.