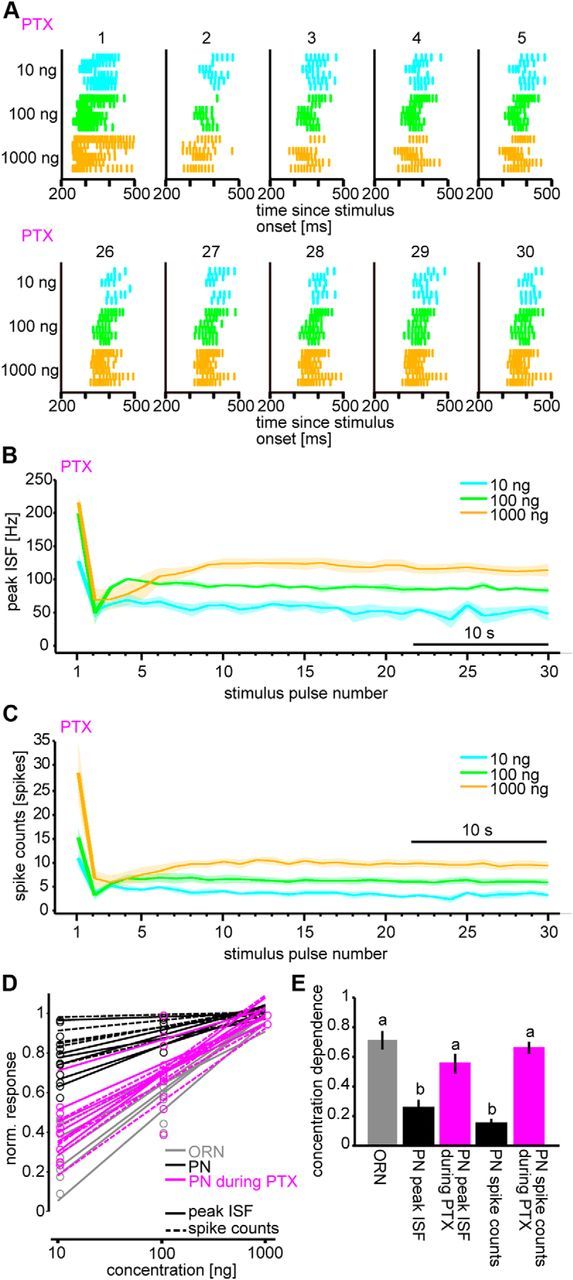
Figure 5.

Responses of PNs to intermittent bombykol stimuli under GABAA receptor blockage with PTX. A, Raster plots of PN responses to the first through fifth stimulus pulses (top) and to the 26th through 30th pulses (bottom) during application of PTX (n = 6). B, C, Dynamics of average peak ISF (B) and average spike counts (C) in PN responses during application of PTX (n = 6; shaded areas represent SEM). D, Linear fits of normalized ORN responses from imaging data (gray) and normalized PN responses described by peak ISF (solid line) and spike counts (dashed line) before (black) and during application of PTX (magenta). The normalized responses calculated from average settled response levels to last 10 stimulus pulses at each odorant concentration are shown as circles. Values were normalized within each set of odorant concentrations for each parameter and pharmacological condition. E, Odorant concentration dependencies corresponding to the slopes of fitted curves in D. p < 0.05, significant differences indicated by different letters associated with the data groups (one-way ANOVA followed by Tukey–Kramer test). n = 6; data are mean ± SEM.
