
Figure 6.
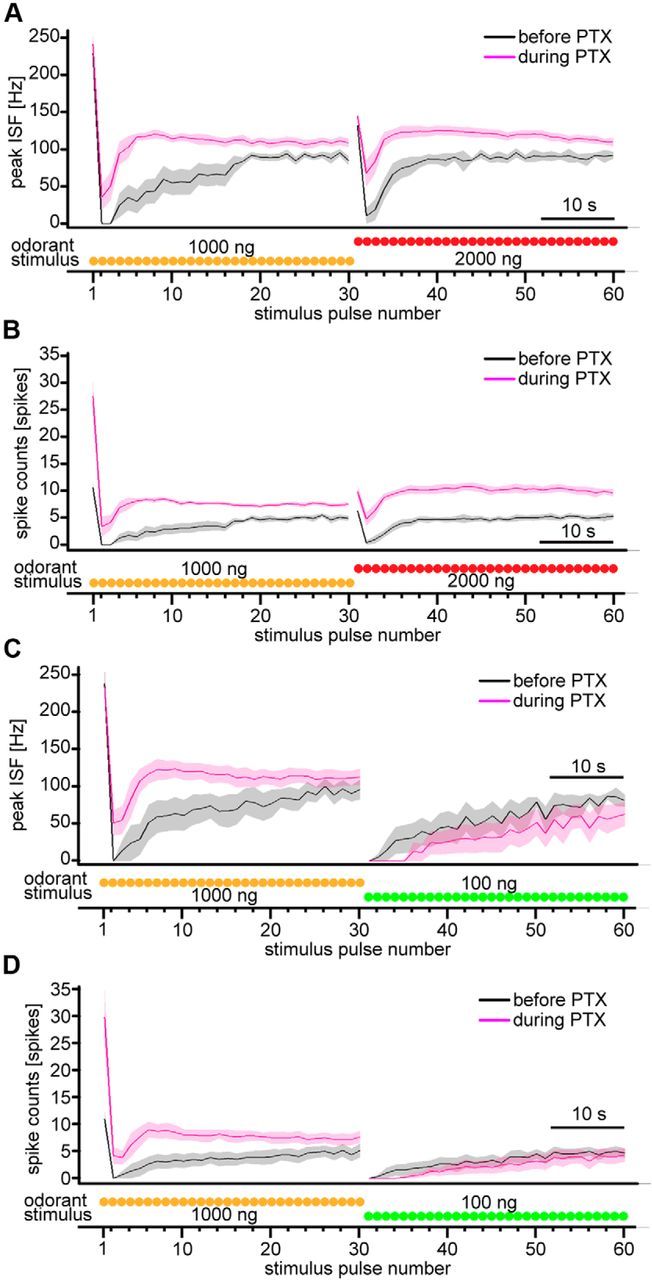
PN responses to intermittent bombykol stimuli upon odorant concentration change in pulse trains and the effect of GABAAR blockade with PTX. A, B, Dynamics of average peak ISF (A) and average spike counts (B) of PN responses with odorant concentration increase before (black) and during (magenta) application of PTX (n = 8; shaded areas represent SEM). Odorant concentration was increased from 1000 to 2000 ng after the 30th stimulus pulse. C, D, Dynamics of average peak ISF (C) and average spike counts (D) of PN responses with odorant concentration decrease before (black) and during (magenta) application of PTX (n = 6; shaded areas represent SEM). Odorant concentration was decreased from 1000 to 100 ng after the 30th stimulus pulse. Traces below the figures represent stimulus timing and odorant concentration schematically.