Figure 7.

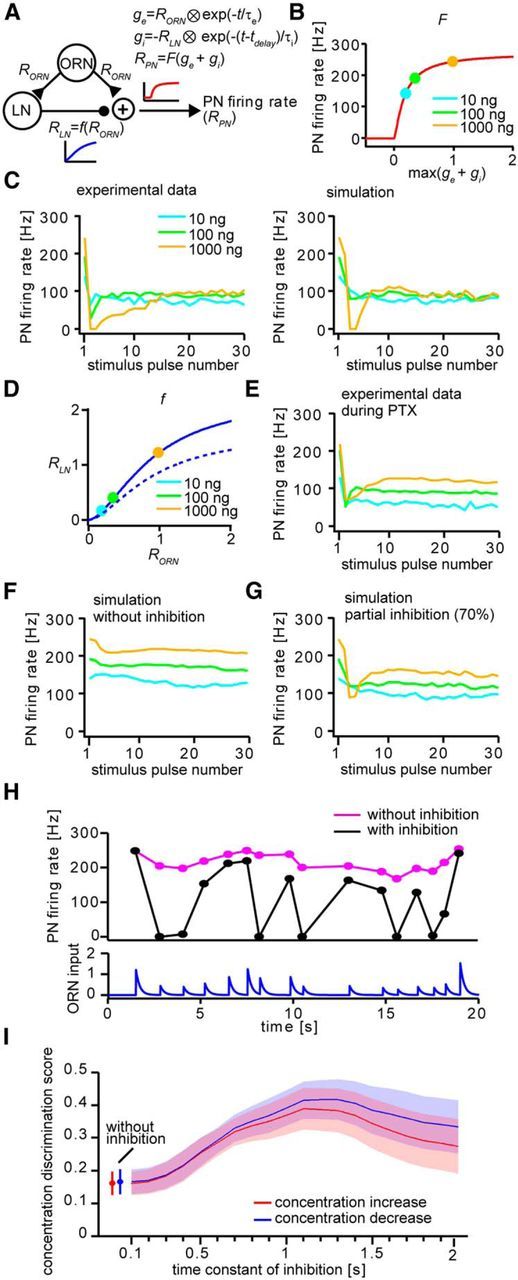
Simulation of PN responses. A, Schematic diagram of the model. RORN, RLN, and RPN, Response amplitudes of ORN, LN, and PN, respectively; ge, excitatory synaptic conductance of LN and PN activated by ORN input; gi, inhibitory synaptic conductance of PN activated by LN; τe and τi, time constants of excitatory and inhibitory conductances; tdelay, onset delay of inhibitory conductance; t, time; F, transfer function of PN from synaptic conductance to firing rate (shown in B); f, transfer function to determine LN response amplitude (shown in D). B, Transfer function of PN from synaptic conductance to firing rate. Markers indicate the corresponding odorant concentrations used in the actual experiments at gi = 0. max(ge + gi), the local maximum of ge + gi for a stimulus. C, PN responses in the actual experiment (left, same as Fig. 2D) and fitted PN responses in the simulation (right) to intermittent odorant stimuli. D, Transfer function to determine LN response amplitude (solid curve). Markers indicate the corresponding odorant concentrations used in the actual experiments. The transfer function for partial inhibition (dashed curve, corresponding to the result shown in G) was generated by decreasing the maximum amplitude (RLNmax) by 30%. E, Electrophysiologically recorded PN responses to intermittent odorant stimuli during application of PTX in the actual experiment to intermittent odorant stimuli (same as Fig. 5B). F, Simulated PN responses in the simulation to intermittent odorant stimuli without inhibition. G, Simulated PN responses in the simulation to intermittent odorant stimuli with partial inhibition (70%). H, Representative simulated PN responses to naturalistic odorant stimuli with (black) and without (magenta) inhibition. Traces below the figures show the time course of ORN input to the PN and LN. I, Effect of inhibition time constant on odorant discrimination performance. Shown are average odorant concentration discrimination scores (error bars or shaded areas represent SEM; n = 8) for concentration increase (red) and decrease (blue) for inhibition time constants in the range of 0.1–2 s.
