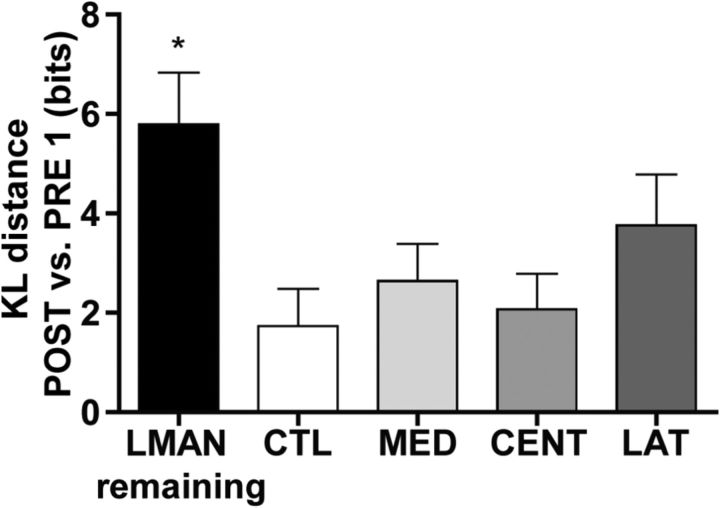
Figure 5.
Quantification of changes in syllable acoustic features after HVC subregion ablation by group. Values are Kullback–Leibler (KL) distances of all POST singing from PRE1, calculated using a composite measure of syllable acoustic features (duration, pitch, FM, entropy, and pitch goodness). Data are the mean ± SEM of these values within groups. Only birds with LMAN remaining were significantly different from CTL birds (*p < 0.05). A nonsignificant trend is observed when LAT birds are compared with CTL birds (p = 0.15).

