
Figure 2.
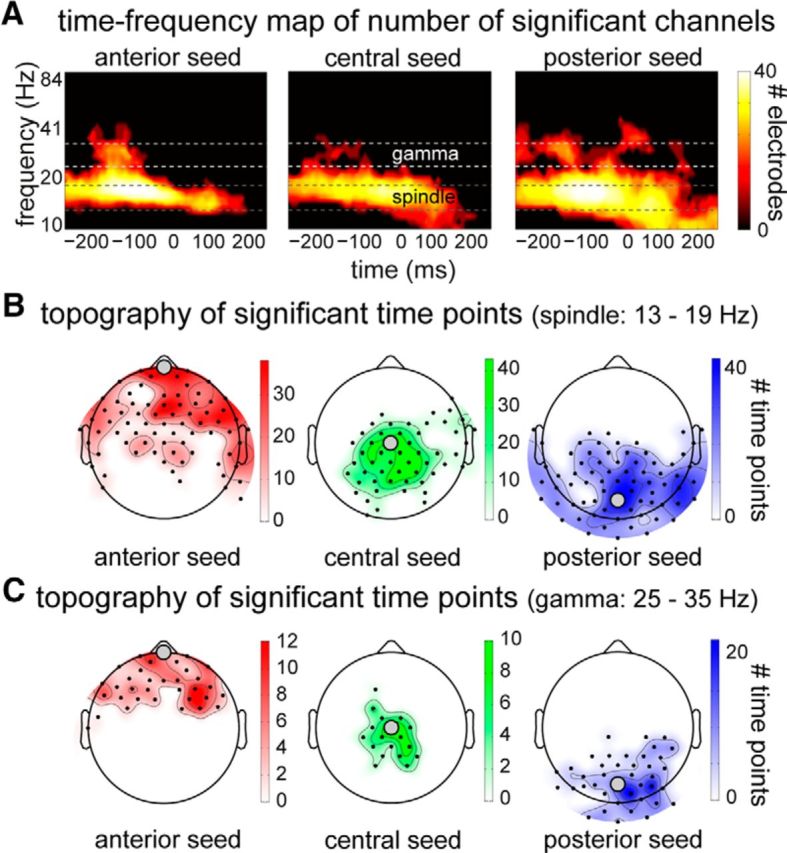
Spatiotemporal extent of SO-phase effect on power. A, Heat maps of clusters with significantly higher power in the up versus down state for the anterior (left column), central (middle column), and posterior seed electrodes (right column). Indicated is the number of channels involved at every time–frequency point. Note the apparent presence of two distinct frequency ranges in these clusters, indicated between dashed lines and labeled “spindle” and “gamma.” B, C, Topographies of these frequency-specific effects (B, spindles; C, gamma) reveal that power modulations are highly localized. Channels closer to the seed electrode used for SO detection are involved in the significant cluster on more time points.