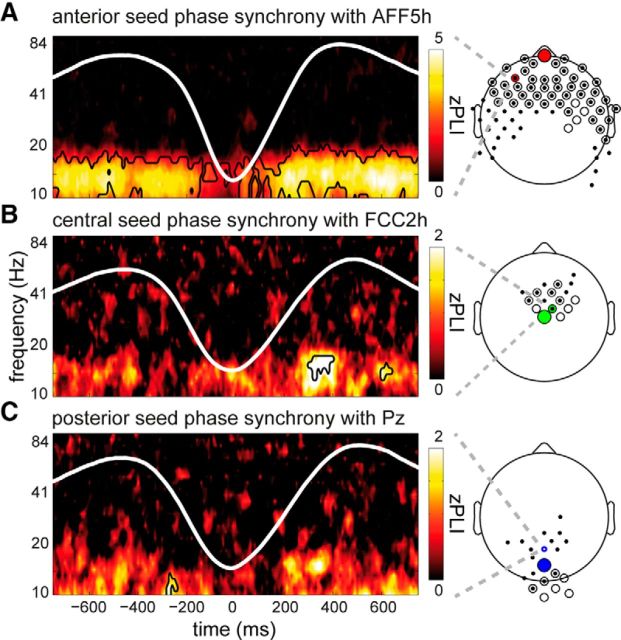
Figure 5.
Phase synchrony in the sleep spindle range. Heat maps showing Z-transformed PLI estimates for single, representative channels, indicating functional connectivity with the anterior (A), central (B), and posterior (C) seed electrode. Extent of significance is outlined. Scalp plots represent spatial topography of channels significantly coupled with seed electrode. Small filled circles and larger open circles represent channels belonging to distinct clusters, with some channels partaking in both clusters. Large colored circles represent seed electrodes. Small colored circles represent the example channel locations used for the heat maps.

