
Figure 8.
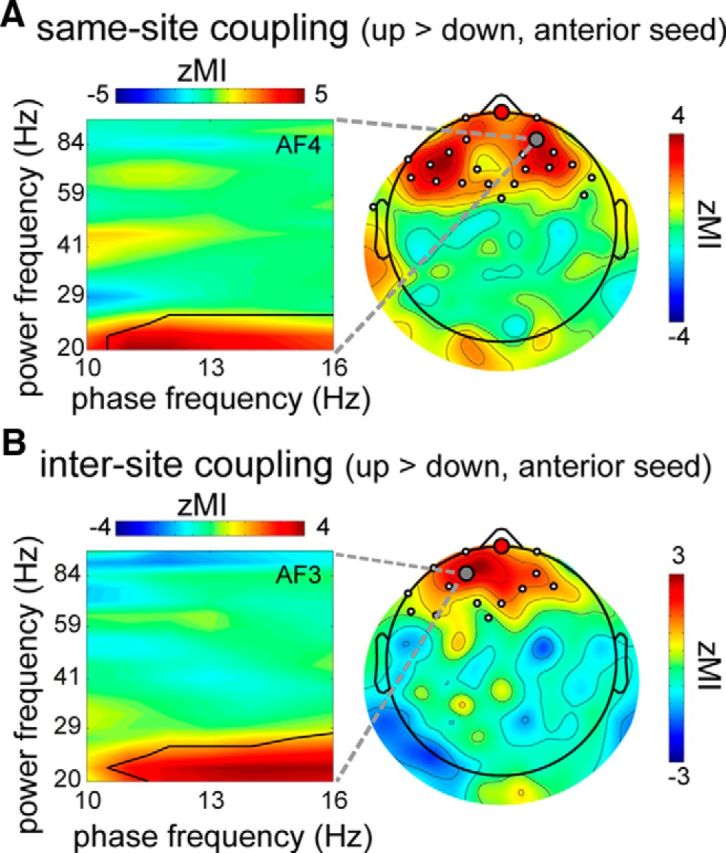
SO phase-dependent cross-frequency coupling using anterior seed. A, Left, Same-site coupling difference (Z-transformed MI) between up- and down-centered epochs for example channel (gray circle in scalp plot). Black line indicates extent of (beta band) significance. Right, Topography showing enhanced frontal coupling in up state relative to down state, averaged over 11–16 Hz modulating range and 20–24 Hz modulated range. B, Similar to A, only for up-down difference in intersite coupling with anterior seed. Scalp plot averaged over 11–16 Hz modulating range and 20–27 Hz modulated range.