Figure 3.
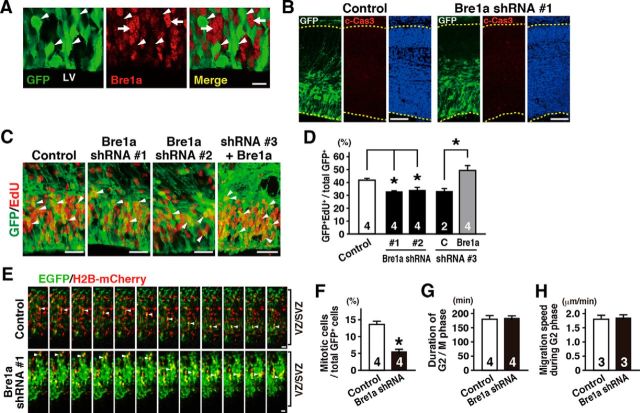
Bre1a knockdown in neural precursor cells reduces the proportion of mitotic cells. A–D, Bre1a shRNA or control shRNA and GFP expression plasmids were microinjected into the lateral ventricle (LV) of E13.5 embryos and electroporated into the dorsal forebrain in utero. The embryos were fixed 24 h after electroporation, and the brains were analyzed. A, GFP+ Bre1a shRNA-expressing cells (arrowheads) are less immunopositive for Bre1a than surrounding GFP− cells (arrows). B, Cryosections were immunostained for GFP and c-Cas3, followed by Hoechst nuclear staining. C, D, EdU was injected intraperitoneally into dams 2 h before fixation. Coronal cryosections were immunostained for GFP, followed by EdU visualization (C), and GFP +/EdU+ cells were counted (D). Bre1a expression plasmids were coelectroporated with Bre1a shRNA 3 to rescue the effects of Bre1a knockdown. E–H, Bre1a or control shRNA plasmids together with GFP and H2B-mCherry expression plasmids were coelectroporated into the dorsal forebrain of E13.5 embryos in utero. Twenty-four hours after electroporation, coronal slices were made and cultured on a hydrophilic transparent membrane in serum-free media for 30 h. E, Time-lapse images of GFP+/mCherry+ cells in the VZ/SVZ. Arrowheads indicate cells undergoing cell divisions, which were precisely recognized by the observation of H2B-mCherry expression (red). F–H, The percentage of GFP+ cells that underwent mitosis during the 30 h culture (F), the duration of the G2/M phase of GFP+ cells (G), and the migration speed of GFP+ cells in the G2 phase (H) in the VZ/SVZ were quantified. Scale bars: A, 20 μm; B, 100 μm; C, E, 30 μm. Error bars indicate SEM, and n values are shown in columns. *p < 0.05 by one-way ANOVA followed by Dunnett's post hoc comparison (D) or Student's t test (F–H).

