Figure 5.
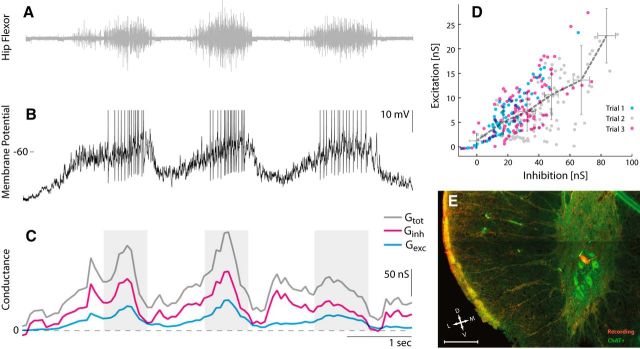
Sample motoneuron in D10 from an intact spinal cord receiving balanced synaptic input. A, Hip flexor nerve recording during tactile induced pocket scratching. B, Vm during constant current injection (Iinj = 0). Action potentials clipped at −40 mV. C, The total conductance (gray), inhibition (magenta), and excitation (cyan) estimated with the ACF method using a 250 ms window. Shaded regions indicate the location for which the windows contained spikes. D, Inhibition and excitation estimated with the ACF method without spikes for three trials. The gray dashed line connects the x–y averages in six bins on the abscissa. Error bars indicate their respective SD. E, Transverse histological section to confirm the biocytin-filled neuron (red) used in A–D belongs to the group of motoneurons in the ventral horn (ChAT-positive neurons shown in green). Scale bar, 200 μm.

