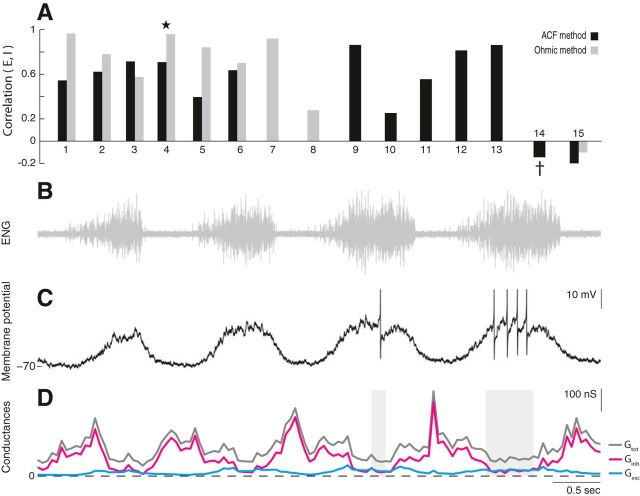
Figure 6.
Balanced E/I in the majority of cells, with the exception of two cells. A, The correlation between excitation and inhibition for a population of neurons (n = 15), estimated via the ACF method (black) and ohmic method (gray). Most cells (n = 13) have a positive correlation between E and I, with the exception of two cells. A sample cell from Figure 5 is indicated by a star. B–D, Sample neuron receiving opposite timing of E and I. B, Flexor nerve recording. C, Membrane potential (Iinj = 0) of sample neuron 14 (†). Action potentials clipped at −30 mV. D, The total conductance (gray), inhibition (magenta), and excitation (cyan) estimated with the ACF method using a 200 ms window. Shaded regions indicate the omitted locations in which the windows contained spikes.

