
Figure 5.
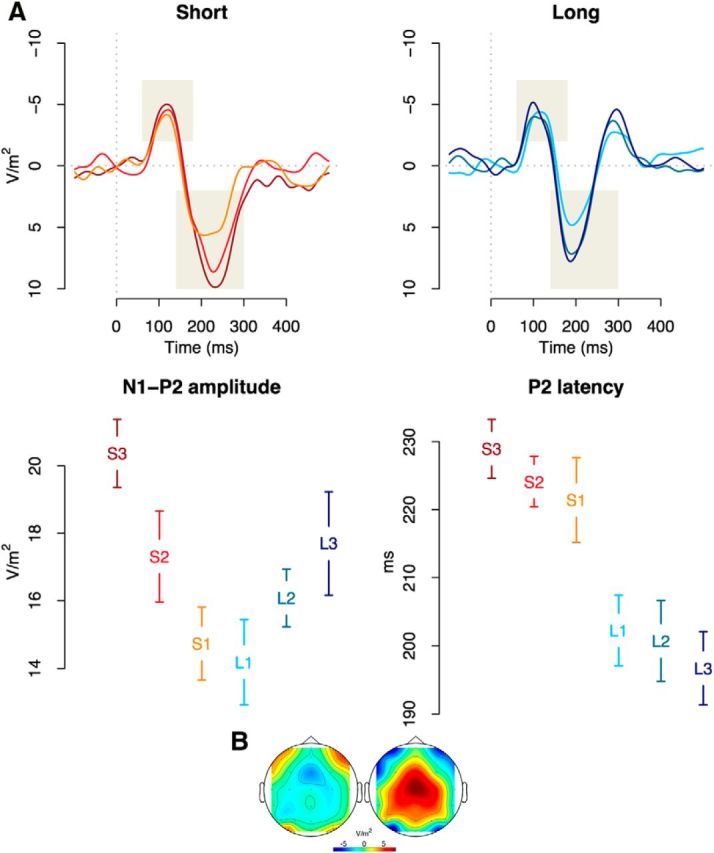
EPs triggered by the offset of CI interval. A, The top panels illustrate the post-CI auditory evoked potentials for CIs shorter and longer than the SI, recorded at FCz. Shaded areas represents measurement areas for amplitude and latency of N1 and P2 components. The bottom left panel depicts the amplitude of the N1P2 complex, which increases as a function of distance to the SI. The bottom right panel illustrates the latency decrease of the P2 component as a function of CI length. B, Topographies of N1 (80–120 ms) and P2 (180–240 ms) peaks, collapsed over all participants and conditions.