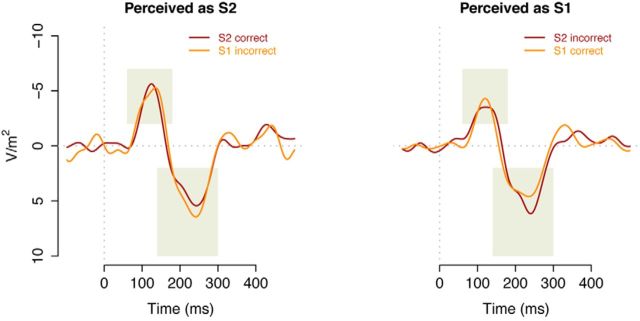
Figure 7.
The post-CI EPs for CIS trials, measured at the FCz electrode and plotted separately for the presentation of S1 and S2 durations. The left panel depicts the EPs in correctly classified trials (i.e., indicated S1 for an S1 trial, or S2 for an S2 trial); the right panel depicts the EPs for incorrectly classified trials (i.e., indicated S2 for an S1 trial or vice versa). Shaded areas represent measurement areas for amplitude and latency of N1 and P2 peaks.

