Figure 3.
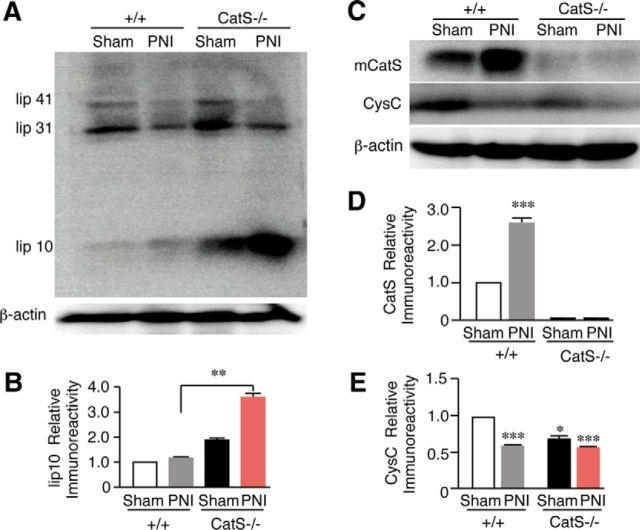
The results of the immunoblot analyses of lip10, CatS, and CysC in the spleens of wild-type and CatS−/− mice. A, The accumulation of lip10 in the spleens of sham-operated, wild-type mice or CatS−/− mice 14 d after PNI. B, The mean protein levels of lip10 in the spleens of sham-operated, wild-type or CatS−/− mice 14 d after PNI. Each column and vertical bar represents the mean ± SEM of three independent experiments for each time point. Asterisks indicate a statistically significant difference between the values (**p < 0.01). C, The changes in the levels of CatS and CysC in the spleens of sham-operated, wild-type mice or CatS−/− mice 14 d after PNI. The mean protein levels of mature CatS (D) and CysC (E) in the spleens of sham-operated, wild-type or CatS−/− mice 14 d after PNI. Each column and vertical bar represents the mean ± SEM of three independent experiments for each time point. Asterisks indicate a statistically significant difference from sham-operated wild-type mice (**p < 0.01).

