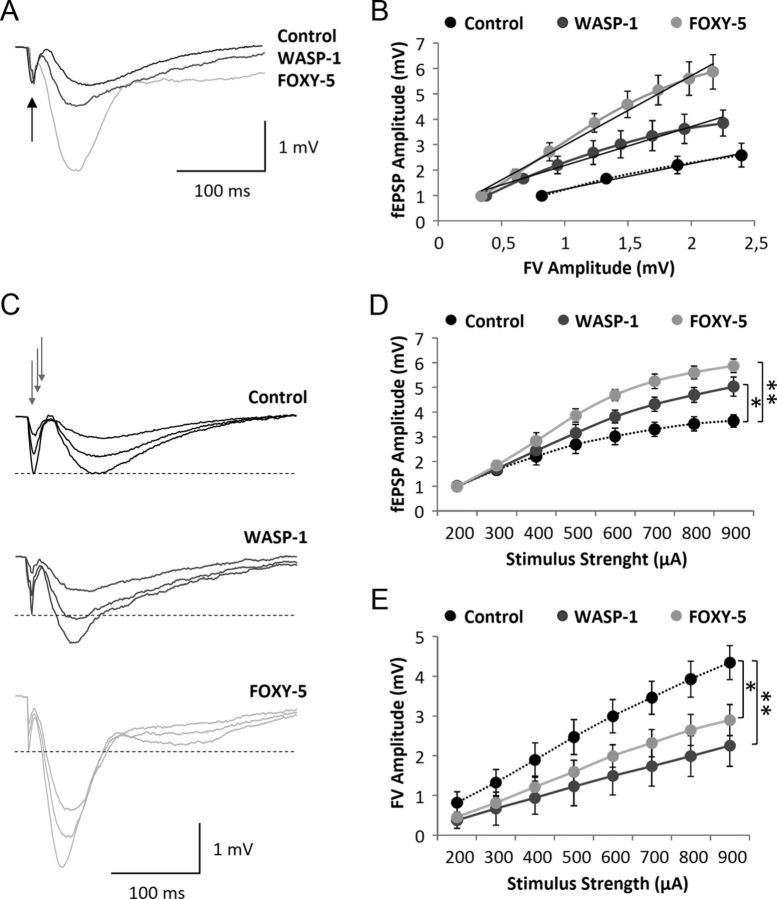
Figure 2.
Wnt activators enhance basal excitatory synaptic transmission in adult wild-type mice. A–E, Field recordings of hippocampal slices from WASP-1 (n = 10), FOXY-5 (n = 10), and control (n = 10) mice. A, Representative synaptic responses for equal fiber volley (FV) amplitude (black arrow). B, Correlation of fEPSP and FV amplitudes for each group. Black lines are the regression line for fEPSP (output) and FV (input). The correlation coefficients (R2) in the control, WASP-1, and FOXY-5 mice were 0.9855, 0.9714, and 0.9869, respectively. C, Average traces of fEPSP at three different intensities of stimulation (gray arrows). Dotted lines indicate FV amplitude of 1 mV. D, Plot of fEPSP amplitude versus stimulus intensity (from 200 to 900 μA). E, Plot of FV amplitude versus stimulus intensity (from 200 to 900 μA).

