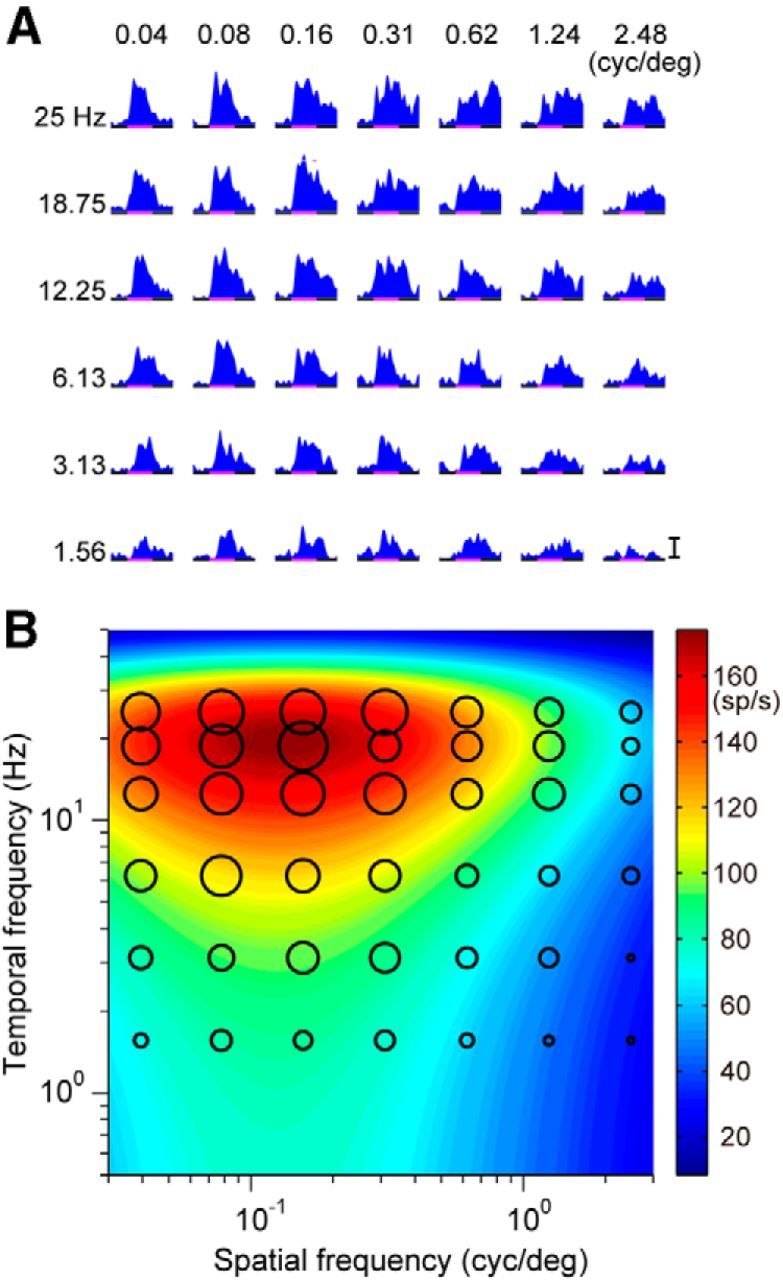
Figure 2.

Spatiotemporal response tuning of a neuron in area MST. A, Neuronal responses of a single cell to drifting gratings with various spatiotemporal frequencies (25, 18.75, 12.25, 6.13, 3.13, and 1.56 Hz from top to bottom; 0.04, 0.08, 0.16, 0.31, 0.62, 1.24, and 2.48 cycles/° from left to right). The bar indicates 100 spikes/s. B, Contour plots of the best-fit 2D Gaussian functions in Fourier space. Magnitudes of the values are indicated by colors (blue, lower; red, higher). The diameters of the filled circles indicate the average of the spike density from 40 to 100 ms after onset of motion for each stimulus.
