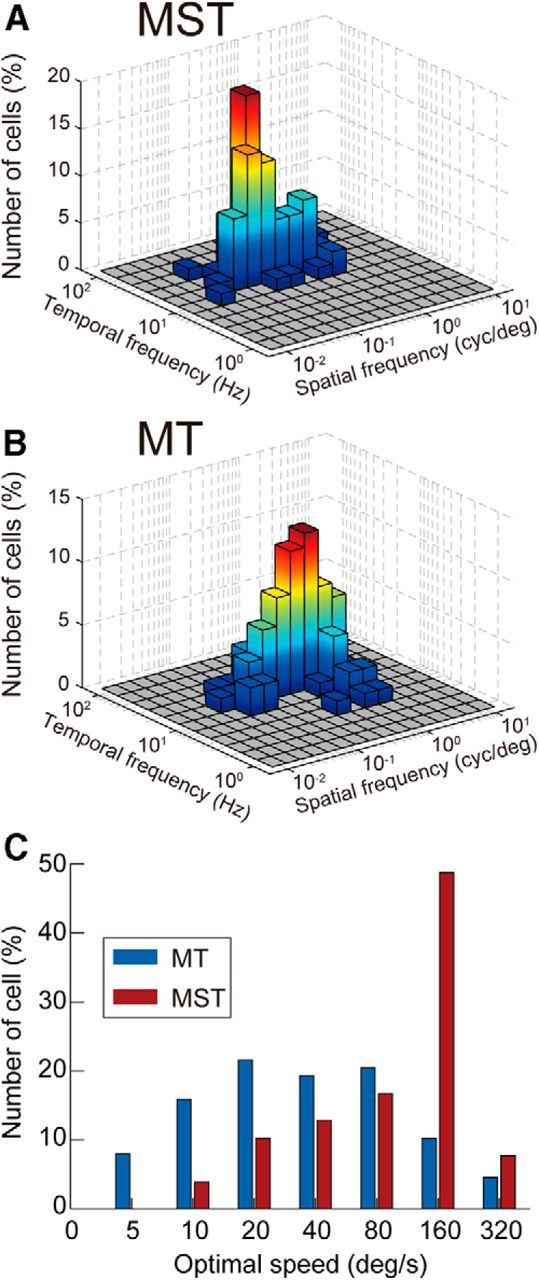
Figure 4.

Spatiotemporal response tuning of individual neurons in areas MT and MST. A, B, Distributions of optimal spatiotemporal frequencies in MT (A) and MST (B). C, Distribution of speeds of the optimal gratings. Blue and red bars indicate the distributions of MT neurons and MST neurons, respectively. Note the logarithmic abscissa.
