Figure 10.
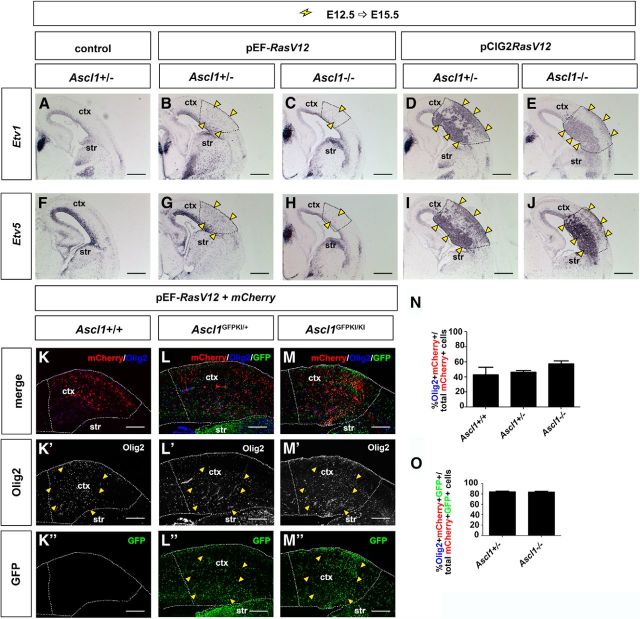
Ascl1 is not required for OPC differentiation in response to RAS/ERK signaling. A–J, E12.5→15.5 electroporations of Ascl1+/− (A, B, D, F, G, I) or Ascl1−/− (C, E, H, J) cortices with mCherry (A, F), or pEFRasV12+mCherry (B, C, G, H), or pCIG2RasV12 (D, E, I, J). Transfections were analyzed for the transcripts of Etv1 (A–E) or Etv5 (F–J). K–O, E12.5→15.5 electroporations of Ascl1+/+ (K–K″), Ascl1GFPKI/+ (L–L″), and Ascl1GFPKI/KI (M–M″) cortices with pEFRasV12+mCherry imaged for the coexpression of mCherry (red), GFP (green), and Olig2 (blue). Quantitation of percentage of double-positive cells (Olig2+mCherry+ cells/mCherry+ cells; N) and triple-positive cells (Olig2+mCherry+GFP+ cells/mCherry+GFP+ cells; O) in Ascl1+/+, Ascl1GFPKI/+, and Ascl1GFPKI/KI cortices. p > 0.05. Dashed lines outline the transfected region in the neocortex. Yellow arrowheads mark the cells with ectopic expression of Etv1 (B–E), Etv5 (G–J), or Olig2 (K′–M′). Scale bars: A–J, 500 μm; K–M, K′–M′, K″–M″, 250 μm. ctx, cortex; str, striatum.

