Figure 2.

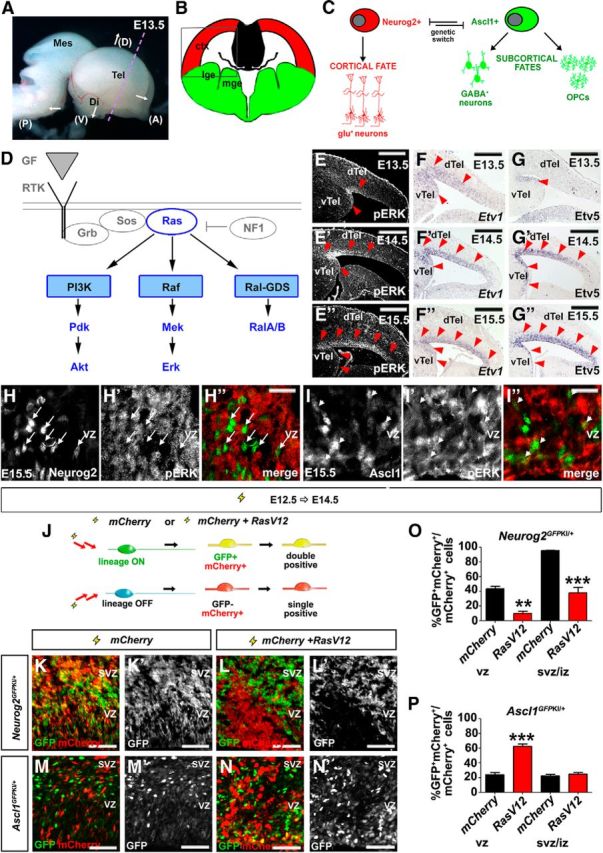
RAS signaling is required to regulate a Neurog2-Ascl1 genetic switch in cortical progenitors. A, Dissected E13.5 brain showing coronal plane of section (dotted purple line). B, Schematic illustration of a frontal section through the telencephalon, with the boxed area indicating the targeted area of the neocortex used in all electroporations. C, Cortical progenitors are bipotent, normally selecting a glutamatergic neuronal fate under the proneural activity of Neurog2, but retaining the potential to differentiate into GABAergic neurons or OPCs in response to Ascl1. D, Schematic illustration of signaling pathways activated downstream of RTK/RAS signaling. E–G, Dynamic expression of pERK (E–E″), Etv1 (F–F″), and Etv5 (G–G″) in E13.5, E14.5, and E15.5 cortex. Red arrowheads mark lateral-to-medial expansion of expression. H, I, E15.5 cortical sections double-stained for pERK (red) and Neurog2 (green; H–H″), or Ascl1 (green; I–I″). Arrows mark the cells in which Neurog2 and pErk expression are mutually exclusive. Arrowheads mark the cells in which pErk and Ascl1 are coexpressed. J–P, Schematic illustration of lineage tracing experiments in which an mCherry expression vector was electroporated with or without RasV12 into E12.5 Neurog2GFPKI/+ or Ascl1GFPKI/+ cortical progenitors (J). GFP/mCherry expression in E12.5→E14.5 electroporated Neurog2GFPKI/+ (K, K′, L, L′) and Ascl1GFPKI/+ (M, M′, N, N′) brains. Quantification of GFP and mCherry coexpression in VZ or SVZ/IZ cells of Neurog2GFPKI/+ (O) and Ascl1GFPKI/+ (P) brains. *p < 0.05, **p < 0.01, ***p < 0.005. Scale bars: E–G, E′–G′, E″–G″, 250 μm; H″, I″, 67.5 μm; K–N, K′–N′, 125 μm. A, anterior; ctx, neocortex; D, dorsal; di, diencephalon; dTel, dorsal telencephalon; GF, growth factor; lge, lateral ganglionic eminence; mes, mesencephalon; mge, medial ganglionic eminence; P, posterior; tel, telencephalon; V, ventral; vTel, ventral telencephalon.
