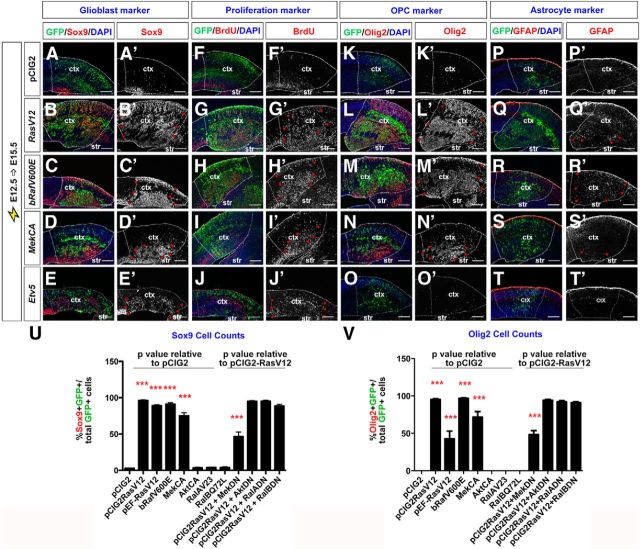
Figure 5.
RAS/ERK signaling promotes proliferation and a glial cell fate in cortical progenitors. E12.5→E15.5 electroporations of a pCIG2 control vector (A, A′, F, F′, K, K′, P, P′), RasV12 (B, B′, G, G′, L, L′, Q, Q′), bRafV600E (C, C′, H, H′, M, M′, R, R′), MekCA (D, D′, I, I′, N, N′, S, S′), and Etv5 (E, E′, J, J′, O, O′, T, T′) vectors (expressing). Transfected brains were analyzed for coexpression of GFP with Sox9 (A–E, A′–E′), BrdU (30 min pulse; F–J, F′–J′), Olig2 (K–O, K′–O′), or GFAP (P–T, P′–T′). Dashed lines outline the transfected region in the neocortex. Red arrowheads mark transfected cells ectopically expressing Sox9 (B′–E′), BrdU (G′–J′), Olig2 (L′–N′), or GFAP (Q′–S′). Scale bars: 250 μm. U, V, Quantification of GFP+ cells coexpressing Sox9 (U) or Olig2 (V). p values of pCIG2RasV12, pEFRasV12, pCIG2bRafV600E, pCIG2MekCA, pCIG2AktCA, pCIG2RalAV23, and pCIG2RalBQ72E are relative to pCIG2 control, whereas p values of pCIG2RasV12+pCIG2MekDN, pCIG2RasV12+pCIG2AktDN, pCIG2Rasv12+pCIG2RalADN, and pCIG2RasV12+pCIG2RalBDN are relative to pCIG2RasV12. *p < 0.05, **p < 0.01, ***p < 0.005. ctx, neocortex; str, striatum.

