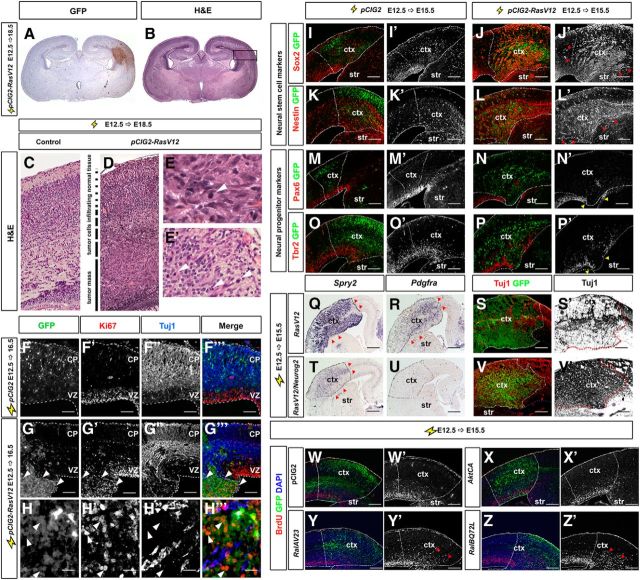
Figure 6.
Activation of RAS signaling in cortical progenitors results in tumorigenesis. A–E, E18.5 control (C) and E12.5→E18.5 brains electroporated with pCIG2RasV12 (A, B, D, E, E′) were processed for H&E staining (B–E, E′), or GFP transcripts (A). F–H, E12.5→E16.5 electroporations of a pCIG2 control vector (F–F‴) and pCIG2RasV12 (G–G‴, H–H‴). Transfected brains were analyzed for coexpression of GFP (green), proliferation marker Ki67 (red), and pan-neuronal marker Tuj1 (blue). White arrowheads mark RasV12 transfected cells expressing Ki67 instead of Tuj1 (H–H‴). I–P, E12.5→E15.5 brains electroporated with a pCIG2 control vector (I, I′, K, K′, M, M′, O, O′) or pCIG2RasV12 (J, J′, L, L′, N, N′, P, P′) were processed for immunostaining of pan-neural progenitor markers Sox2 (I, I′, J, J′) and Nestin (K, K′, L, L′), cortical-specific progenitor markers Pax6 (M, M′, N, N′), and Tbr2 (O, O′, P, P′). Red arrowheads mark ectopic expression of Sox2 (J′) and Nestin (L′), while yellow arrowheads mark transfected areas with reduced expression of Pax6 (N′) and Tbr2 (P′). Q–V, E12.5→E15.5 electroporations of pCIG2RasV12 with (T–V, V′) or without Neurog2 (Q–S, S′). Transfected brains were analyzed for the transcripts of Spry2 (Q, T), Pdgfa (R, U), or coexpression of GFP and Tuj1 (S, S′,V, V′). Red arrowheads mark ectopic expression of Spry2 (Q, T) or Pdgfa (R). W–Z, E12.5→E15.5 electroporations of pCIG2 (W, W′), AktA (X, X′), RalAV23 (Y, Y′), and RalBQ72L (Z, Z′) followed by analysis of BrdU incorporation. Red arrowheads mark ectopic BrdU incorporation. Dashed lines outline the transfected region in the neocortex. Scale bars: I–V, I′–V′, F–F‴, G–G‴ 250 μm; H–H‴, 67.5 μm. CP, cortical plate; ctx, neocortex; str, striatum.

