Figure 1.
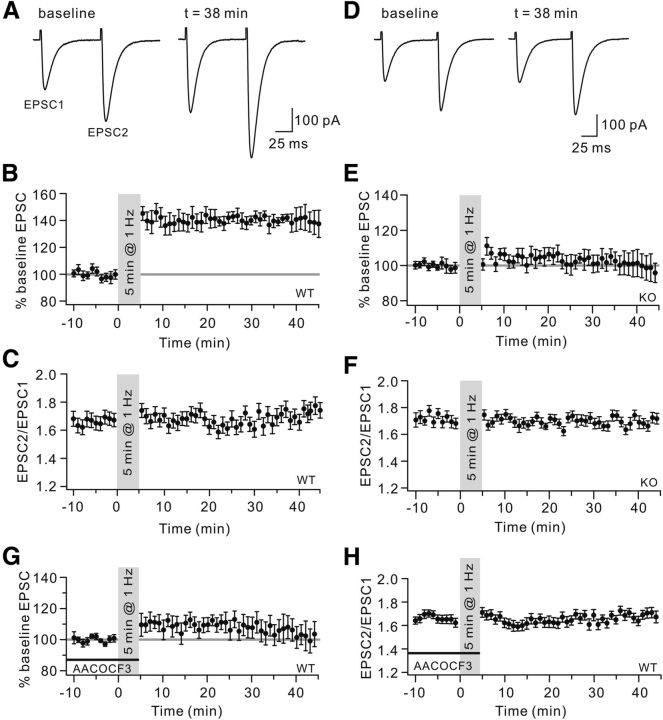
The 1 Hz PF-LTP is deficient in cPLA2α KO mice. A, PF-LTP was induced by PF stimulation at 1 Hz for 5 min. Example EPSCs before (baseline) and after (t = 38 min) stimulation are shown. Both EPSC1 and EPSC2 were potentiated after stimulation. B, Time course of percentage change in EPSC1 amplitude (n = 20). Each data point indicates the average of three successive EPSCs evoked at 0.05 Hz. C, Time course of the PPF ratio (EPSC2/EPSC1) from a subset of the cells shown in B. D, Example EPSCs from one KO cell before (baseline) and after (t = 38 min) stimulation. EPSC amplitude was unaltered by the stimulation. E, Time course of percentage change of EPSC1 amplitude (n = 14). Each data point indicates the average of three EPSCs. F, Time course of the PPF ratio from cells shown in E. G, Time course of percentage change of EPSC1 amplitude when WT cells were locally perfused with 100 μm AACOCF3 before and during stimulation (n = 11), indicating that AACOCF3 blocked the LTP induction (n = 11). H, Time course of the PPF ratio of EPSCs from cells shown in G.

