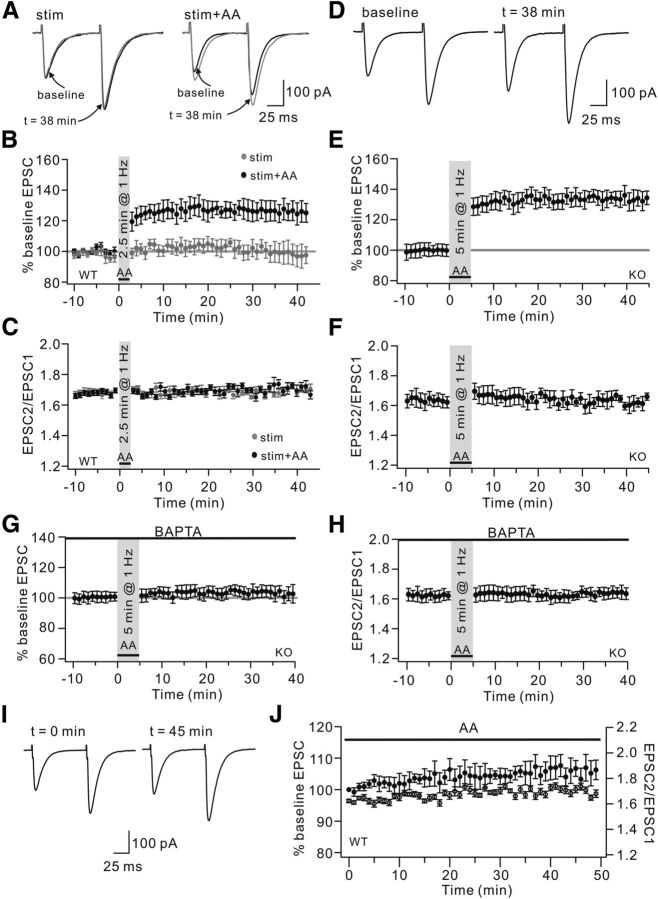
Figure 2.
AA is involved in PF-LTP. A, Example PF-EPSCs from WT cells stimulated for 2.5 min at 1 Hz (stim) or locally perfused with 2 μm AA overlapping the 1 Hz stimulation (stim+AA). Black and gray traces represent EPSCs before (baseline) and after (t = 38 min) the stimulation, respectively. EPSCs were potentiated in the stim+AA group but not in the stim group. B, Time course of percentage changes of EPSC amplitudes in “stim” and “stim+AA” groups. Each data point indicates the average of three EPSCs. C, Time course of the PPF ratio from cells shown in B. D, KO cells were locally perfused with 2 μm AA overlapping the 1 Hz stimulation for 5 min. Example PF-EPSCs before (baseline) and after (t = 38 min) stimulation are shown. E, Time course of percentage change of EPSC amplitude. Each data point indicates the average of three EPSCs. F, Time course of PPF ratio from cells shown in E. G, Time course of percentage change of PF-EPSC amplitude when KO cells were locally perfused with 2 μm AA overlapping 1 Hz stimulation for 5 min. These cells were internally perfused with 10 mm BAPTA. The mean EPSC amplitude at 38 min was 100 ± 4% of baseline (n = 9). p > 0.05 compared with baseline. H, Time course of PPF ratio of EPSCs from cells shown in G. I, Example EPSCs at 0 and 45 min when WT cells were perfused with 2 μm AA. J, Time courses of percentage change of EPSC amplitude (filled circles) and PPF ratio (open circles). Black bar represents the presence of AA.

