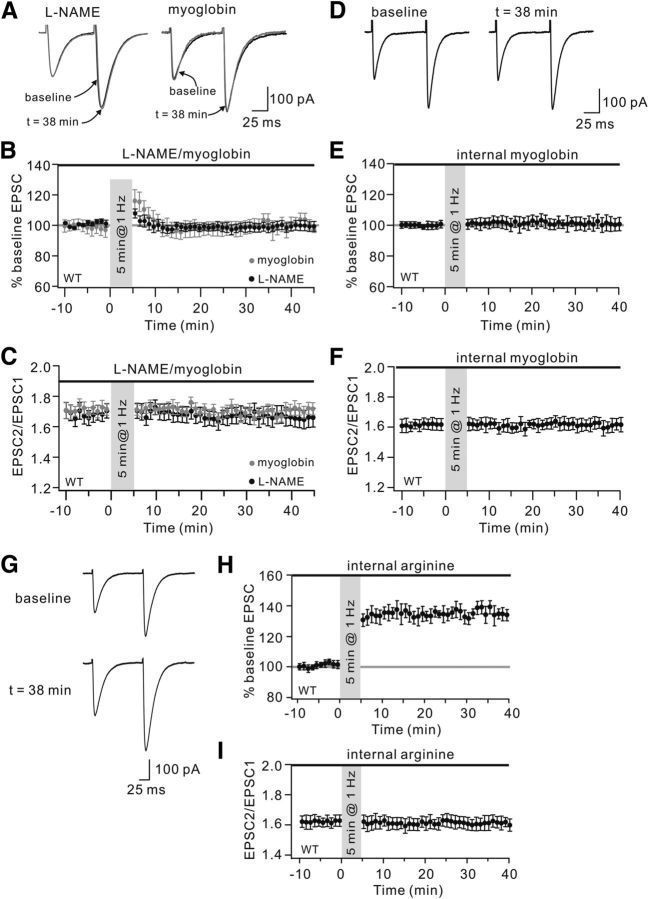
Figure 4.
NO is required for PF-LTP. A, LTP induction in WT cells perfused with l-NAME or oxymyoglobin (myoglobin) in the bath. Both groups were stimulated for 5 min at 1 Hz. Black and gray traces represent EPSCs before (baseline) and after (t = 38 min) stimulation, respectively. B, Time course of percentage change of EPSCs in l-NAME and oxymyoglobin groups. Each data point indicates the average of three consecutive EPSCs. Black bars represent the duration of application of l-NAME and myoglobin. C, Time course of PPF ratio from cells shown in B. D, The 1 Hz LTP was blocked by the inclusion of oxymyoglobin inside PCs. Representative traces show EPSCs before (baseline) and after (t = 38 min) stimulation. E, Time course of percentage change of EPSCs with internal oxymyoglobin (n = 10). The mean EPSC amplitude at 38 min was 100 ± 5% of baseline (n = 13). p > 0.05 compared with baseline. Each data point indicates the average of three consecutive EPSCs. The bar above represents the inclusion of oxymyoglobin in PCs (internal myoglobin). F, Time course of PPF ratio from cells shown in E. G, Example traces show EPSCs before (baseline) and after (t = 38 min) stimulation. The 1 Hz LTP was normal when 5 μm arginine was included in the recording pipettes. H, Time course of percentage change of EPSCs with internal arginine (n = 9). The mean EPSC amplitude at 38 min was 134 ± 3% of baseline (n = 13). p < 0.01 compared with baseline. Each data point indicates the average of three consecutive EPSCs. Bar indicates the duration of arginine included in PCs (internal arginine). I, Time course of PPF ratio from cells shown in H.

