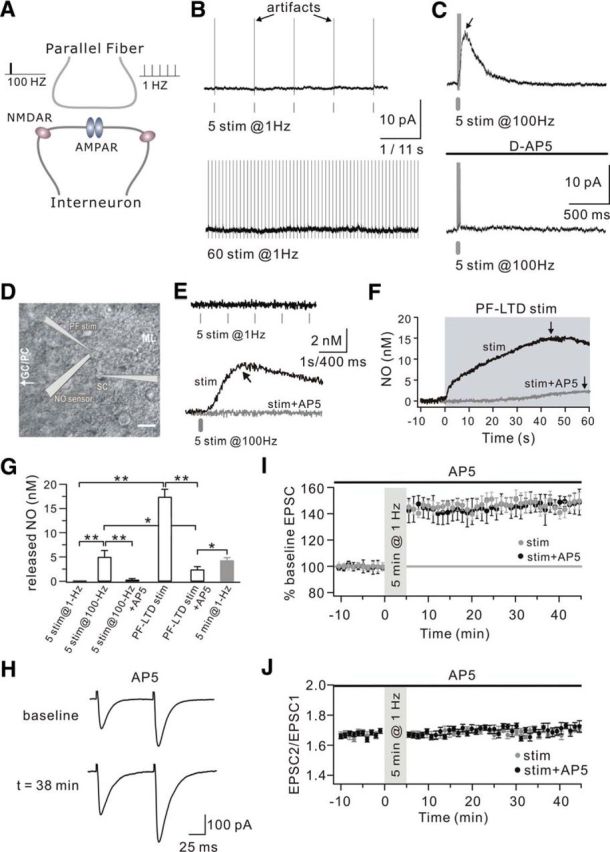
Figure 6.

NMDAR-mediated NO release from SCs. A, Schematic illustration showing the stimulation protocols at PF-SC synapses and the localization of postsynaptic AMPARs and NMDARs in SCs. PF stimulation (100 Hz or 1 Hz) was applied at PF-SC synapses as high- and low-frequency stimuli, respectively. AMPARs are located in the center, whereas NMDARs are extrasynaptic. B, Representative recordings from one SC in response to 5 (top) and 60 (bottom) PF stimuli given at 1 Hz. Cells were clamped at 40 mV and perfused with GYKI53655 to block AMPAR responses. Time scales: top, 1 s; bottom, 11 s. C, Representative recordings from one SC in response to 5 PF stimuli given at 100 Hz. Cells were clamped at 40 mV and perfused with GYKI53655 to block AMPAR-mediated responses. High-frequency stimulation induced an outward current, which was blocked by the application of 50 μm d-AP5 (bottom). D, DIC image illustrating the recording configuration for NO release from one SC. Glass pipettes for PF stimulation and whole-cell recording in the SC as well as an NO electrode were placed on the slices as shown in the illustration. ML, Molecular layer; GC/PC, granule cells/Purkinje cells. Scale bar, 20 μm. E, Examples of NO recording from one SC evoked by 1 Hz and 100 Hz PF stimulation. Slices were perfused with Mg2+-free aCSF containing GYKI53655. The responses for 1 Hz and 100 Hz PF stimulation are shown in the top and bottom as labeled. Time scales: top, 1 s; bottom, 400 ms. The black arrow indicates the peak of NO release. The gray trace in the bottom represents that 50 μm d-AP5 blocked PF stimulation-induced NO release. F, Examples of NO recording when PFs were given the induction for PF-LTD (PF-LTD stim). Slices were perfused with Mg2+-free aCSF containing GYKI53655. The shadowed background shows the duration of PF-LTD stimulation. The black and gray traces represent the NO responses with PF-LTD stimulation and PF-LTD stimulation plus d-AP5 (stim+AP5), respectively, showing that d-AP5 blocked most of the NO release. The black arrows indicate the peak of NO release in each condition. G, Averaged peak values of NO efflux under different stimulation conditions. Five pulses at 1 Hz (5 stim at 1 Hz): 0, n = 12. Single pulse at 100 Hz (5 stim at 100 Hz): 4.9 ± 1.3 nm, n = 9. Single pulse at 100 Hz with d-AP5 (5 stim at 100 Hz+AP5): 0.3 ± 0.2 nm, n = 6. PF-LTD stimulation (PF-LTD stim): 17.4 ± 1.5 nm, n = 6. PF-LTD stimulation with d-AP5 (PF-LTD stim+d-AP5): 2.3 ± 0.5 nm, n = 4. For comparison, the released NO in response to 5 min PF stimulation at 1 Hz shown in Figure 5F is replotted (5 min at 1 Hz, gray bar). *p < 0.05. **p < 0.01. H, Example traces of PF-EPSCs before (baseline) and after (t = 38 min) 1 Hz stimulation when slices were perfused with d-AP5. I, Time course of percentage change of EPSC amplitude in response to 5 min stimulation at 1 Hz (stim; n = 10) and the overlapping application of 50 μm d-AP5 with 1 Hz stimulation (stim+AP5). Each data point indicates the average of three successive EPSCs evoked at 0.05 Hz. J, PPF ratios from a subset of the cells shown in I.
