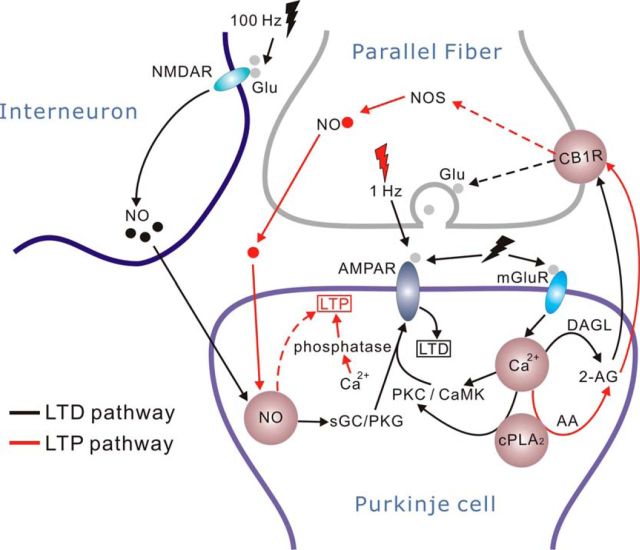
Figure 7.
A schematic illustration shows the major signaling molecules involved in the induction of 1 Hz PF-LTP (red lines) and PF-LTD (black lines). Red and black flash signs indicate the stimulations for LTP and LTD, respectively. The stimulation for LTD simultaneously activates postsynaptic AMPARs and mGluRs on PCs and NMDARs on interneurons. Dotted lines indicate the unclear cascades. Bright brown circles represent shared molecules (NO, Ca2+, cPLA2α, and CB1R) in LTP and LTD.

